Content
Published:
As from 2014 the statistics is publised with Population and population changes.
Populations in municipalities rapidly increasing
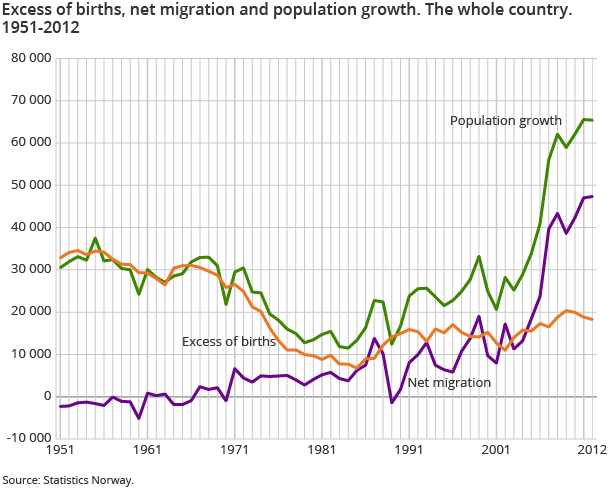
The overview of population changes in the municipalities since 1951 is now updated with figures for 2012. The population is still increasing and the growth was 1.3 per cent last year. This is the second highest percentage growth since the 1920s, and one of the highest in Europe.
| 1951 | 2011 | 2012 | |
|---|---|---|---|
| The figures for 2012 where corrected at 10:30 am on the publishing day. The figures for 2011 where corrected 19th of April 2013 at 8:45 am | |||
| Population 1 January | 3 280 296 | 4 920 305 | 4 985 870 |
| Live births | 60 571 | 60 220 | 60 255 |
| Deaths | 27 736 | 41 393 | 41 992 |
| Excess of births | 32 835 | 18 827 | 18 263 |
| In-migrations | 6 046 | 79 498 | 78 570 |
| Out-migrations | 10 172 | 32 466 | 31 227 |
| Net-migrations | -2 316 | 47 032 | 47 343 |
| Population growth | 30 525 | 65 565 | 65 405 |
| Population 31 December | 3 310 821 | 4 985 870 | 5 051 275 |
The tables for the municipalities show yearly figures for population size, population increase, surplus of births, net migration, in-migration and out-migration for the whole country, the counties and the municipalities.
Net immigration doubled since 2006
In 2012, we reached a new peak in net immigration of 47 300 persons. There was a slight decrease in the population growth last year, which is due to a slight decline in the birth surplus. In recent years, the population growth has been twice as high as the average for the 1950s and 1960s, and four times as high as in the period 1975-1990. Apart from four individual years, the birth surplus has been the primary reason for population growth in the period up to 2004, but from 2005, net immigration has been the primary reason, and in 2012, net immigration made up almost three-quarters of the population growth.
Rogaland, Akershus and Oslo had the highest growth in 2012
The county of Rogaland had the highest population growth in 2012. The population increased by 2 per cent, and was 0.7 per cent more than the national average. In Akershus and Oslo the population increased by 1.8 and 1.7 per cent respectively. Oslo had the largest immigration from abroad followed by Rogaland, with 2.7 and 2.1 per cent respectively.
Geographical variations
The population changes in the counties and in some municipalities can vary considerably from the national average. There may be factors other than demographic reasons, such as decisions on regional development, power development, location of asylum centres, etc. In addition, figures for municipalities often vary from one year to another due to random circumstances.
Changes in municipal boundaries cause complications
The figures in the tables dating back to 1951 relate to the municipal borders in existence at any given time. The numerous and often extensive local regulations in the period, particularly in the 1960s, make comparisons over time difficult in many municipalities, especially in relation to population numbers and totals such as number of births, deaths, in-migrations and out-migrations.
The statistics is published with Population.
Contact
-
Statistics Norway's Information Centre
E-mail: informasjon@ssb.no
tel.: (+47) 21 09 46 42

