Content
Published:
This is an archived release.
Continued decline in internal migration
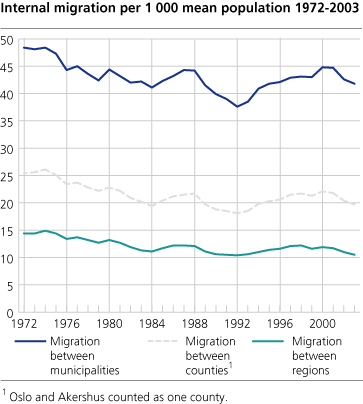
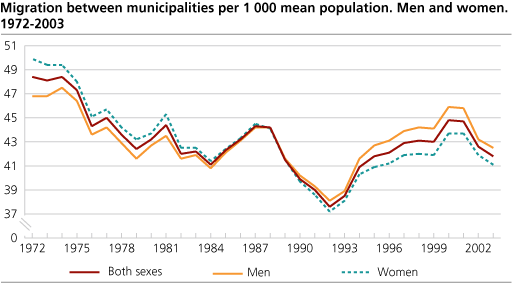
190 895 persons moved between to municipalities in 2003 - a decrease of about 2 200 from 2002. This is the lowest number of internal migrations since 1997. Less than 4.2 per cent of the population moved between two municipalities in 2003, and since the 1950s the proportion has only been lower in 1984 and 1989-1994.
109 450 persons changed county of residence in 2003 - a decrease of 3000 from 2002. The entire decrease in movements between municipalities is due to movements between counties. The number of migrations between two municipalities in the same county has not changed. When Oslo and Akershus is counted as one county, the number of movements between two counties was 89 900, or almost 2.0 per cent of the population. The corresponding figure for movements between regions was 1.1 per cent. The low proportion of migrants in 2003 may, as in the end of the 1980s and the beginning of the 1990s, be seen in relation to rising unemployment and economic insecurity.
Highest in-migration to Akershus and Østfold
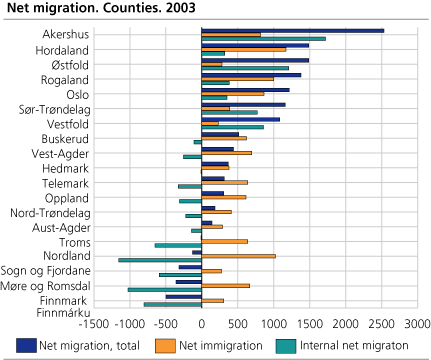
In absolute figures the counties Akershus and Østfold had the largest net in-migration with 1 720 and 1 210, while Nordland had the largest net out-migration with 1155. In relation to the population, Østfold had the largest net in-migration with 4.7 pr 1000 mean population, followed by Vestfold with 3.9. Finnmark had a net out-migration with 10.7 pr thousand. As a main seeing, the counties northwards from Sogn and Fjordane, with the exception of Sør-Trøndelag, had a larger net out-migration.
Only seven counties had an internal net in-migration, while all had a net in-migration from abroad. Taking the immigration from abroad into consideration, only the counties Sogn og Fjordane, Møre og Romsdal, Troms and Finnmark had net out-migration in total.
Continued out-migration from rural areas
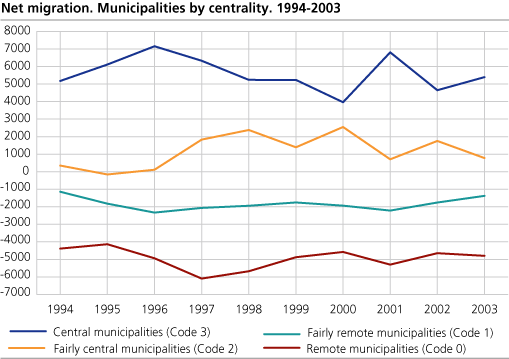
There has been a continued centralization in the internal migration pattern since the World War 2, showing that more people move from the rural areas to the larger cities than the opposite way. Though there have been variations. Normally there is less centralization in period with low economic growth. In the 1970s there were political incentives to stop the centralization, which stopped the process a few years. In all years since the beginning of the 1990s figures show that there has been a net out-migration from rural areas to the central areas. The largest flows have gone to the areas around Oslofjorden, but other larger cities other places in the country have also taken part in the centralization process.
Most young women move
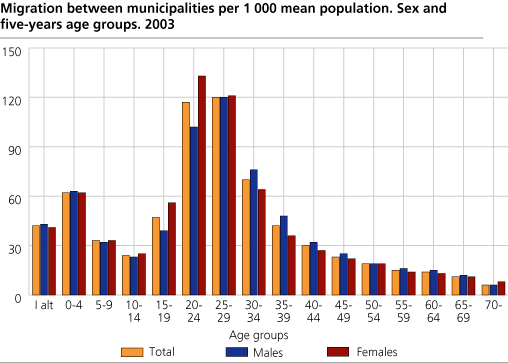
In relation to the population most people aged 20-29 years changed their municipality of residence in 2003. Women aged 20-24 years were most mobile, where 13.3 per cent move from one municipality to another. Men were most mobile in the age group 25-29 years with 12.0 per cent. For those aged 70 years and older, only 6 in 1000 moved between two municipalities.
In 2003 almost 4.3 per cent of the men and 4.1 per cent of the women moved between two municipalities. From the World War II until 1998 the mobility was higher for men than for women, but the difference became smaller. After 1988 the mobility has been higher for men, but the difference is small. This change is partly due to changes in the population structure. There are more old women than men, and the old in the society move less than the rest of the population. Since 1945 there has also been a change in attitudes and increased gender equality have influenced men and women's migration pattern. Today women more often take higher education compared to men, and the differences in men and women's employment rate have decreased. It is no longer as certain that the women move to the man's house when marriage or cohabitation is arranged.
More people move within a municipality
392 545 people moved within a municipality in 2003 - an increase of almost 28 000 from 2002. On average for the country, 8.5 per cent of the men and 8.7 per cent of the women moved within a municipality. The largest proportion of the population moved in Oslo with 13.8 per cent. There were more women than men that moved with 14.2 to 13.8 per cent respectively. Bodø had the second largest proportion with 12.8 per cent. As a general seeing, the highest proportion of the population move in the larger cities.
Also see the statistics about Immigration and emigration
The statistics can also to be found in StatBank where the users may produce their own tables.
Tables:
- Table 1 All migrations. Internal and immigration/emigration, by county. 1966-2003
- Table 2 Migration within and between counties and between counties and foreign countries. 2003
- Table 3 Internal migration, immigration and emigration, by sex, age of migrants and county. 2003
- Table 4 Internal migration. 1951-2003
- Table 5 Internal migration, by county. 1966-2003
- Table 6 Net migration between counties. 2003
- Table 7 Migration within and between regions. 2003
- Table 8 Net migration between regions. 2003
- Table 9 Internal migration, by sex and age of migrants, and age-specific rates for males and females. 2003
- Table 10 Internal migration, by sex, marital status and 5-year age groups. 2003
- Table 11 Internal migration, by sex, age of migrants and county. 2003
- Table 12 Migration to/from municipalities and counties. 2003
- Table 13 Internal migration. In-migration, out-migration and net migration. Economic region. 2003
- Table 14 Migration within municipalities. 2003
- Table 15 Internal migration. Migration between municipalities, by centrality. Age and sex. 2003
- Table 16 Internal migration. Net migration, by centrality of municipalities. Migration between municipalities with the same centrality are included. The whole country. 1996-2003
Contact
-
Statistics Norway's Information Centre
E-mail: informasjon@ssb.no
tel.: (+47) 21 09 46 42
-
Oppdrag befolkningsstatistikk
E-mail: befolkning@ssb.no
-
Even Høydahl
E-mail: even.hoydahl@ssb.no
tel.: (+47) 95 77 79 06

