Content
Published:
This is an archived release.
One out of seven migrated in 2012
In 2012, 777 900 migrations took place either within or between Norwegian municipalities, or also to and from Norway. Not since 1975 has the level of migratory activity between municipalities been higher, compared to the population size.
| 2012 | 2003 - 2012 | |
|---|---|---|
| 1Regions: Akershus/ Oslo (Akershus and Oslo). Hedmark/Oppland (Hedmark and Oppland). South Eastern Norway (Østfold, Buskerud, Vestfold and Telemark). Agder-Rogaland (Aust-Agder, Vest-Agder and Rogaland). Western Norway (Hordaland, Sogn og Fjordane and Møre og Romsdal). Trøndelag (Sør-Trøndelag and Nord-Trøndelag). Northern Norway (Nordland, Troms Romsa and Finnmark Finnmárku) | ||
| 1 Oslo and Akershus | 2 198 | 26 910 |
| 2 Hedmark and Oppland | -948 | -4 101 |
| 3 Sør-Østlandet | 2 486 | 18 971 |
| 4 Agder and Rogaland | -224 | 624 |
| 5 Vestlandet | -1 443 | -17 256 |
| 6 Trøndelag | 438 | 3 186 |
| 7 Nord-Norge | -2 480 | -28 307 |
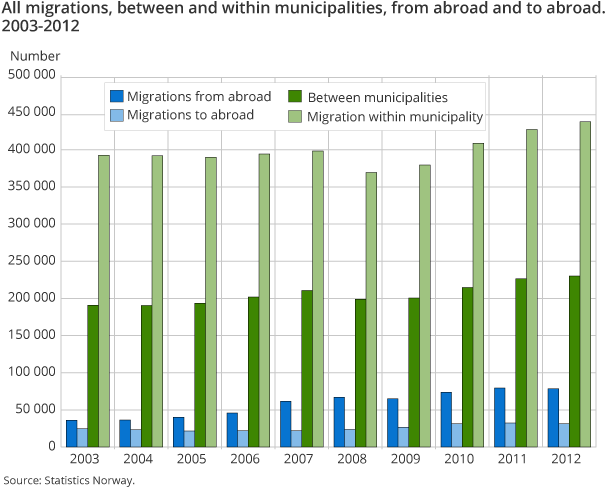
The migratory activity corresponded to one migration per seven inhabitants. Migrations within the municipalities corresponded to 8.7 per cent of the population, with a total of 437 800 migrations, and migrations between Norwegian municipalities corresponded to 4.6 per cent of the population with 230 300 migrations. A total of 78 550 immigrations and 31 200 emigrations completed the picture.
The total number of migrations increased by 12 300 from 2011. Migrations between and within municipalities increased by 4 000 and 10 400 respectively from the year before. The number of immigrations and emigrations decreased slightly from 2011 to 2012.
Still most migration among people aged 20-29 years
As has been the case for more than 20 years, 2012 also showed slightly more activity in migration among males than females, with 47 migrations per 1 000 males and 45 migrations per 1 000 females. As usual, the migratory activity was largest among people aged 20-29 years. This group represented 39 per cent of all migration between municipalities, and their high mobility is connected to education, work and family establishment.
Increase in centralisation
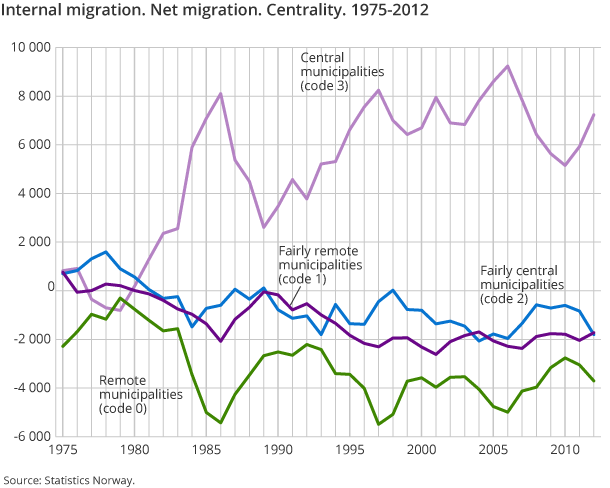
Municipalities in the central areas (code 3) had a migration surplus of 7 200 more in-migrations than out-migrations in 2012. There has been an increase in the centralisation from 2010 onwards, after a decrease from 2006 to 2010. Municipalities in the other centrality levels (0-2) had a loss in net migration.
Largest domestic migration surplus in Akershus and Østfold
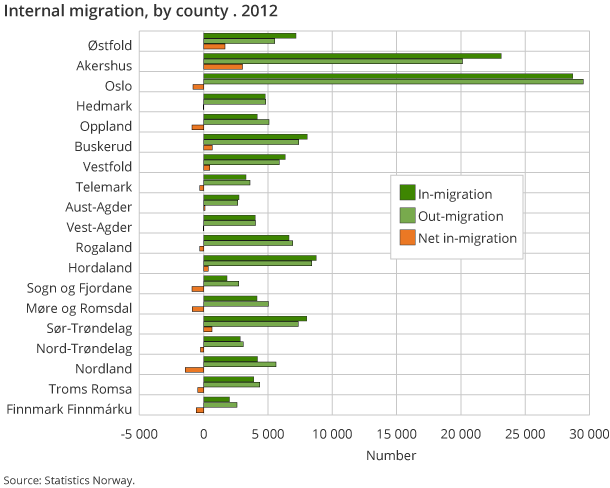
Seven counties had a domestic net migration surplus, and Akershus and Østfold had the greatest surplus with 3 000 and 1 650 respectively. The other twelve counties had a domestic net migration loss, Nordland had the greatest loss, with 1 400. Thereafter followed Sogn og Fjordane, Møre og Romsdal, Oppland and Oslo. The first three of these had a net migration loss of 900 each, whereas the latter had a loss of 800.
All counties had a total net migration surplus in 2012 due to migrations from abroad, which contributed heavily to the surplus, and which has increased markedly in recent years.
There were 134 700 migrations between the counties last year; 3 000 more than in 2011.
CentralisationOpen and readClose
Centralisation is the geographical location of a municipality compared to an urban settlement of a particular size. The level of centralisation is classified in 4 main categories, coded 3, 2, 1, and 0. Code 3 centralisation is achieved when the physical centre of the population of a municipality is within 75 minutes of travel from an urban settlement with a population of a minimum of 50 000 inhabitants (90 minutes from Oslo). To achieve code 3, an additional requirement is that the urban settlement in question acts as a regional centre. Code 2 means a maximum travel of 60 minutes to an urban settlement with the minimum of 15 000 inhabitants. Code 1 means a maximum travel of 45 minutes to an urban settlement with the minimum of 5 000 inhabitants. The municipalities that do not fulfil any of these requirements obtains the code 0.
“Central municipalities” is coded 3, “Fairly central municipalities” is coded 2, “Fairly remote municipalities” is coded 1, and “Remote municipalities” is coded 0.
Contact
-
Statistics Norway's Information Centre
E-mail: informasjon@ssb.no
tel.: (+47) 21 09 46 42
-
Oppdrag befolkningsstatistikk
E-mail: befolkning@ssb.no
-
Even Høydahl
E-mail: even.hoydahl@ssb.no
tel.: (+47) 95 77 79 06


