Content
Published:
This is an archived release.
Life expectancy still increasing
The life expectancy increased by 0.2 years for both sexes from 2004 to 2005, and was the highest ever estimated. Men can expect to live 77.7 years, women 82.5 years.
During the last 20 years the life expectancy in Norway has increased by almost five years for men and nearly three years for women. The gender difference declined markedly in the same period, by nearly two years. Norwegian women can now expect to live almost five years longer than Norwegian men, which is the lowest difference since the 1950s.
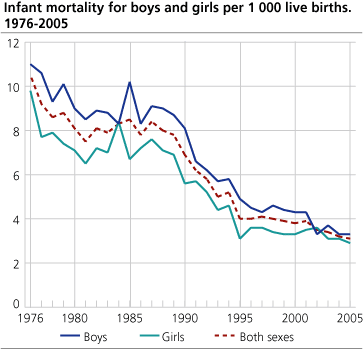
The life expectancy at birth in the period 2001-2005 as compared to 1946-1950 has increased by nine years for girls and almost eight years for boys. An important cause of this is declining infant and child mortality, but lower mortality for older people has also contributed to the increasing life expectancy.
As in previous years Japan had the world's highest life expectancy, with 85.6 years for newborn girls and 78.6 years for boys.
Still relatively few deaths
41 200 persons died in 2005 in Norway, about the same number as in 2004, which had the lowest number of deaths since the late 1970s. Since the late 1990s more women than men have died due to an increasing predominance of women in the ages where most people die.
The infant mortality rate for boys was 3.3 per 1000 live births, a little higher than the rate for girls with 2.9. Thus infant mortality for both sexes was 3.1, the lowest infant mortality ever recorded for Norway.
Updated figures
Tables on expectation of life for males and females are calculated for five years periods, and figures for the period 2001-2005 are now updated and laid into table 6.
Tables:
- Table 1 Deaths and death rates. 1961-2005
- Table 2 Age-specific death rates for males and females. 1971-2005
- Table 3 Expectation of life for males and females at selected ages. 1946-2005
- Table 4 Perinatal and infant mortality. 1956-2005
- Table 5 Life tables. 2005
- Table 6 Expectation of life for males and females at selected ages, by county. 1971-20051 (Published 15 June 2006)
Contact
-
Anders Sønstebø
E-mail: anders.sonstebo@ssb.no
tel.: (+47) 46 66 37 74
-
Magnus Haug
E-mail: magnus.haug@ssb.no
tel.: (+47) 40 81 14 91
-
Ane Margrete Tømmerås
E-mail: ane.tommeras@ssb.no
tel.: (+47) 91 99 29 62
-
Statistics Norway's Information Centre
E-mail: informasjon@ssb.no
tel.: (+47) 21 09 46 42
-
Oppdrag befolkningsstatistikk
E-mail: befolkning@ssb.no


