Content
Published:
This is an archived release.
Strong increase in dividends
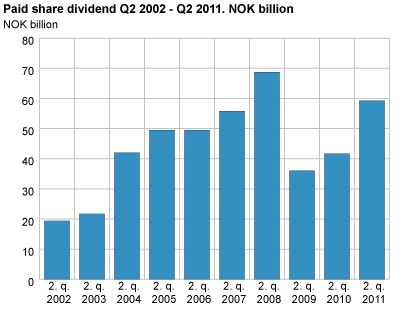
Dividend payout from companies registered with the Norwegian Central Securities Depository (VPS) increased by 40 per cent in the second quarter of 2011 compared to the same quarter last year. The dividends have not been higher since 2008.
After a period of relatively low dividend payouts in 2009 and 2010, the dividends again reached a high level in 2011 and were close to the record payments of 2008. Dividend payout amounted to NOK 59 billion in the second quarter of 2011. By comparison, NOK 42 billion was paid out during the same period last year and NOK 69 billion in record year of 2008.
State-owned enterprises pay the most in dividends
Total dividend payments ended at NOK 59 billion in the second quarter of 2011. Nearly half of the dividends were paid out by state-owned enterprises and one third was paid out by other private enterprises. Foreign companies, who can pay out dividends several times a year, paid out NOK 2.4 billion in the 2nd quarter of 2011.
The largest recipient of dividends was the central government with NOK 22 billion received. NOK 18 billion of these was paid out by the state-owned enterprises. Foreign investors received NOK 17 billion in dividends, while households received NOK 3 billion.
Foreign investors reduce investments
Foreign investors' net purchases of shares amounted to NOK 17 billion in the second quarter. Most of this was, however, purchases made in share issues of companies in the rig sector. Foreign investors’ purchases of shares in the secondary market have thus fallen significantly compared with the previous two quarters.
Households sell shares
After a period where households have invested more in equities than they sold for in the past four quarters, households are again net sellers of shares in the second quarter of 2011. Net sales of shares amounted to NOK 1.3 billion, a significant proportion of which were sales of unlisted shares registered with the VPS.
Increased stocks of debt securities
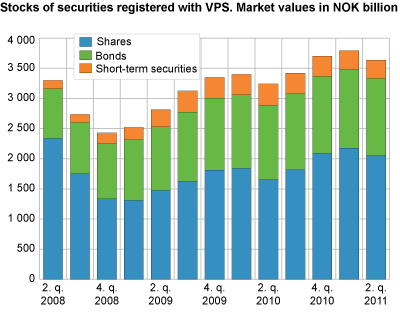
Stocks of debt securities registered with the Norwegian Central Securities Depository were reduced in value in the second quarter of 2011.The stock of bonds were reduced by NOK 20 billion to NOK 1 283 billion. Stocks of short-term debt securities fell by about 3 per cent, to NOK 302 billion, during the same period.
New statistical system affects statisticFrom the first quarter of 2011 a new statistical system was used in the production of the statistic. This has affected the numbers. Particularly the market value of bonds has risen by about NOK 12 billion. Apart from these adjustments, the changes in values are not very significant. The new statistical system will provide higher quality and relevance of the statistic. |
| Q2 2010 | Q3 2010 | Q4 2010 | Q1 2011 | Q2 2011 | |||||||||||||||||||||||||||||||||||||||||||||||||||||||||||||||||||||||||||
|---|---|---|---|---|---|---|---|---|---|---|---|---|---|---|---|---|---|---|---|---|---|---|---|---|---|---|---|---|---|---|---|---|---|---|---|---|---|---|---|---|---|---|---|---|---|---|---|---|---|---|---|---|---|---|---|---|---|---|---|---|---|---|---|---|---|---|---|---|---|---|---|---|---|---|---|---|---|---|---|
| Stocks | |||||||||||||||||||||||||||||||||||||||||||||||||||||||||||||||||||||||||||||||
| Shares | 1 653.7 | 1 815.4 | 2 087.8 | 2 178.1 | 2 055.3 | ||||||||||||||||||||||||||||||||||||||||||||||||||||||||||||||||||||||||||
| Bonds | 1 237.0 | 1 259.4 | 1 278.0 | 1 303.3 | 1 283.8 | ||||||||||||||||||||||||||||||||||||||||||||||||||||||||||||||||||||||||||
| Short-term securities | 349.9 | 345.8 | 337.8 | 311.9 | 301.6 | ||||||||||||||||||||||||||||||||||||||||||||||||||||||||||||||||||||||||||
| Net purchases/sales | |||||||||||||||||||||||||||||||||||||||||||||||||||||||||||||||||||||||||||||||
| Shares | 8.3 | 17.2 | 23.7 | 26.4 | 23.0 | ||||||||||||||||||||||||||||||||||||||||||||||||||||||||||||||||||||||||||
| Bonds | 11.4 | 18.2 | 22.7 | 15.7 | -17.0 | ||||||||||||||||||||||||||||||||||||||||||||||||||||||||||||||||||||||||||
| Short-term securities | 8.0 | -4.3 | -7.1 | -26.8 | -10.1 | ||||||||||||||||||||||||||||||||||||||||||||||||||||||||||||||||||||||||||
| Dividends/cupon payments | |||||||||||||||||||||||||||||||||||||||||||||||||||||||||||||||||||||||||||||||
| Shares | 41.7 | 5.8 | 3.2 | 2.6 | 59.3 | ||||||||||||||||||||||||||||||||||||||||||||||||||||||||||||||||||||||||||
| Bonds | 22.3 | 8.7 | 9.8 | 10.1 | 25.1 | ||||||||||||||||||||||||||||||||||||||||||||||||||||||||||||||||||||||||||
| Short-term securities | 0.3 | 0.4 | 0.3 | 0.4 | 0.5 | ||||||||||||||||||||||||||||||||||||||||||||||||||||||||||||||||||||||||||
The statistics is now published as Securities.
Contact
-
Statistics Norway's Information Centre
E-mail: informasjon@ssb.no
tel.: (+47) 21 09 46 42


