Content
Published:
This is an archived release.
Sharp increase in share values
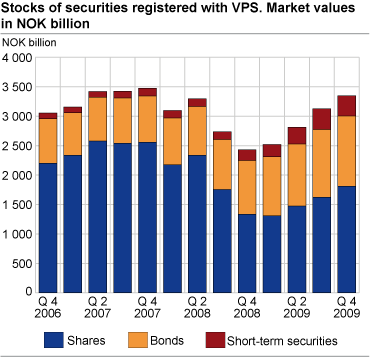
In the last quarter of 2009, the share values registered with The Norwegian Central Securities Depository (VPS) increased by more than NOK 185 billion. The share values increased by more than NOK 500 billion since the first quarter of 2009, when they reached the lowest level since the beginning of the global financial crisis.
The positive development in the stock market in the second and third quarter continued into the fourth quarter, with the share values of the VPS-registered companies increasing by more than NOK 185 billion to nearly NOK 1 810 billion. The main cause of the increased values was rising stock prices at Oslo Stock Exchange. Since the lowest level in February 2009 during the global financial crisis, the share values have increased by nearly NOK 540 billion. There is still some way to go to reach the level of the second quarter of 2007 where share values amounted to NOK 2 579 billion. At the end of the fourth quarter of 2009, the share values of the VPS-registered companies were divided into NOK 1 452 billion of quoted shares and NOK 358 billion of unquoted shares.
Foreign investors back in the stock market
Foreign investors net sold shares registered with the VPS during the whole of 2008 and the first half of 2009. Now, foreign investors are again net purchaseres of shares. During the fourth quarter of 2009, foreigners net purchased shares for more than NOK 8 billion. During the period, foreign investors invested more than NOK 7 billion in shares issued by other financial corporations. Households continued to be net purchasers of shares. During 2009, the households net purchased shares for almost NOK 3.3 billion, of which nearly NOK 1.4 billion was purchased during the last quarter.
Stocks of debt securities
The stock of bonds registered with the Norwegian Central Securities Depository increased by nearly 4 per cent in the fourth quarter to NOK 1 194 billion, and the stock of short-term debt securities decreased by nearly 2 per cent, to NOK 345 billion in the same period. The sharp growth in the stocks of debt securities throughout 2009 is mainly caused by the increase in issuing activity due to government measures established in October 2008 to improve the liquidity in Norwegian banks. During 2009, the stock of bonds increased by nearly 30 per cent and the stock of short-term debt securities increased by nearly 90 per cent.
| Q1 2009 | Q2 2009 | Q3 2009 | Q4 2009 | End of 2009 | End of 20081 | ||||||||||||||||||||||||||||||||||||||||||||||||||||||||||||||||||||||||||
|---|---|---|---|---|---|---|---|---|---|---|---|---|---|---|---|---|---|---|---|---|---|---|---|---|---|---|---|---|---|---|---|---|---|---|---|---|---|---|---|---|---|---|---|---|---|---|---|---|---|---|---|---|---|---|---|---|---|---|---|---|---|---|---|---|---|---|---|---|---|---|---|---|---|---|---|---|---|---|---|
| Stocks | |||||||||||||||||||||||||||||||||||||||||||||||||||||||||||||||||||||||||||||||
| Shares | 1 308.0 | 1 473.5 | 1 624.1 | 1 809.7 | 1 809.7 | 1 333.4 | |||||||||||||||||||||||||||||||||||||||||||||||||||||||||||||||||||||||||
| Bonds | 1 003.6 | 1 053.8 | 1 150.9 | 1 193.7 | 1 193.7 | 916.4 | |||||||||||||||||||||||||||||||||||||||||||||||||||||||||||||||||||||||||
| Short-term securities | 207.4 | 286.3 | 351.9 | 345.1 | 345.1 | 181.9 | |||||||||||||||||||||||||||||||||||||||||||||||||||||||||||||||||||||||||
| Net purchases/sales | |||||||||||||||||||||||||||||||||||||||||||||||||||||||||||||||||||||||||||||||
| Shares | 11.5 | -1.6 | 14.2 | 34.4 | 58.5 | 37.7 | |||||||||||||||||||||||||||||||||||||||||||||||||||||||||||||||||||||||||
| Bonds | 92.1 | 66.7 | 95.0 | 40.9 | 294.8 | 135.9 | |||||||||||||||||||||||||||||||||||||||||||||||||||||||||||||||||||||||||
| Short-term securities | 24.5 | 84.1 | 68.7 | -6.9 | 170.4 | 49.2 | |||||||||||||||||||||||||||||||||||||||||||||||||||||||||||||||||||||||||
| Dividends/cupon payments | |||||||||||||||||||||||||||||||||||||||||||||||||||||||||||||||||||||||||||||||
| Shares | 0.7 | 36.1 | 0.4 | 4.0 | 41.2 | 76.4 | |||||||||||||||||||||||||||||||||||||||||||||||||||||||||||||||||||||||||
| Bonds | 9.3 | 21.4 | 7.2 | 8.2 | 46.1 | 44.6 | |||||||||||||||||||||||||||||||||||||||||||||||||||||||||||||||||||||||||
| Short-term securities | 1.6 | 1.2 | 1.1 | 0.8 | 4.7 | 4.5 | |||||||||||||||||||||||||||||||||||||||||||||||||||||||||||||||||||||||||
| 1 | Corrected 12.02.2010. |
Tables
The statistics is now published as Securities.
Contact
-
Statistics Norway's Information Centre
E-mail: informasjon@ssb.no
tel.: (+47) 21 09 46 42

