Content
Published:
This is an archived release.
Investors net sell mutual fund shares
In the second quarter of 2010, investors net sold mutual fund shares worth more than NOK 7 billion. Investors reduced their holdings in both equity funds and money market funds. The last quarter in which mutual funds in total were net sold was in the fourth quarter of 2008.
From the end of the first quarter of 2010 to the end of the second quarter of 2010, the total value of mutual funds was reduced by NOK 27.7 billion, or 5.8 per cent, to NOK 446.3 billion. Most of the decrease in value was caused by equity funds. These funds were reduced in value by 10.3 per cent.
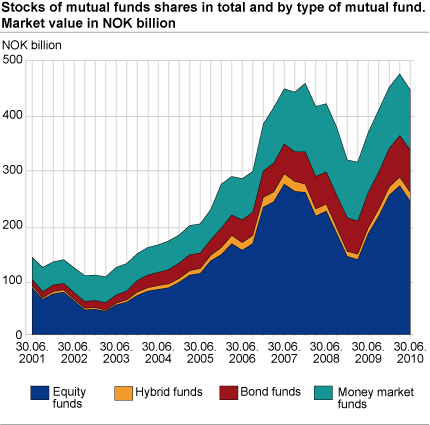
The fall in value of the Norwegian registered mutual funds was due to a loss in the values of the funds` portfolios, as well as net sales of mutual fund shares. Net sales amounted to NOK 7.2 billion, while the fall in value of the shares of NOK 20 billion was due to losses in the funds’ portfolios. Because foreign currencies were relatively stable relative to the Norwegian NOK, the fall in value was mainly caused by falling values in the stock markets.
Investors reduce holdings in equity funds and money market funds
Of the total net sales of mutual fund shares, which amounted to NOK 7.2 billion, as much as NOK 6.3 billion were sold in equity funds. Many sectors net sold mutual fund shares in equity funds during the quarter.
Investors net sold mutual fund shares for NOK 2.7 billion in money market funds. Non-financial enterprises accounted for a large part of the net sales. Investors net sold bond funds and hybrid funds for NOK 1.4 and NOK 0.5 billion in the second quarter of 2010.
Possible hedging gains by households
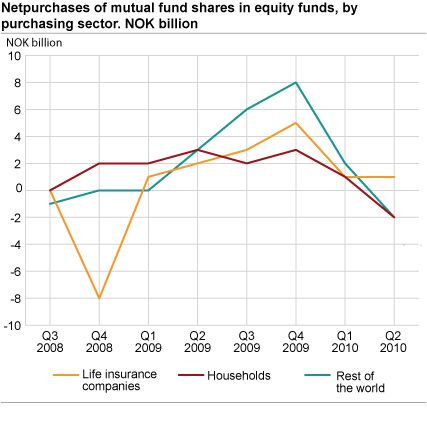
Households net sold NOK 2.2 in shares issued by equity funds in the second quarter of 2010. These sales were followed by a period of six quarters in which households invested NOK 12.1 billion in equity funds. These sales could be due to hedging gains.
Foreign investors net sold shares in equity funds
Foreign investors also net sold shares in equity funds in this year`s second quarter. Net purchases ended at NOK 1.9 billion for this type of fund. Foreign investors invested, on a par with households, relatively large sums in equity funds. In the period from the first quarter of 2009 to the first quarter of 2010, foreign investors placed NOK 18.5 billion in equity funds.
Life insurance companies invest in bond funds
Companies in the life insurance sector invested a total of NOK 1.2 billion in all types of funds. NOK 0.8 billion was placed in bond funds and approximately the same figure was drawn from equity funds. Investing in bond funds is considered a low-risk investment.
Life insurance companies still the largest owner
At the end of the second quarter of 2010, life insurance companies were still the largest owner sector in mutual funds, with an owner share of 28.8 per cent. Households now have an owner share of 26.8 per cent. Foreign investors´ owner share decreased marginally to 14 per cent at the end of the second quarter of 2010.
| Q1 2009 | Q2 2009 | Q3 2009 | Q4 2009 | Q1 2010 | Q2 2010 | ||||||||||||||||||||||||||||||||||||||||||||||||||||||||||||||||||||||||||
|---|---|---|---|---|---|---|---|---|---|---|---|---|---|---|---|---|---|---|---|---|---|---|---|---|---|---|---|---|---|---|---|---|---|---|---|---|---|---|---|---|---|---|---|---|---|---|---|---|---|---|---|---|---|---|---|---|---|---|---|---|---|---|---|---|---|---|---|---|---|---|---|---|---|---|---|---|---|---|---|
| Total | |||||||||||||||||||||||||||||||||||||||||||||||||||||||||||||||||||||||||||||||
| Mutual funds shares capital | 313 151 | 366 313 | 407 386 | 448 739 | 474 148 | 446 428 | |||||||||||||||||||||||||||||||||||||||||||||||||||||||||||||||||||||||||
| Net purchases | 11 318 | 13 682 | 15 711 | 20 414 | 12 272 | -7 157 | |||||||||||||||||||||||||||||||||||||||||||||||||||||||||||||||||||||||||
| General government | |||||||||||||||||||||||||||||||||||||||||||||||||||||||||||||||||||||||||||||||
| Mutual funds Mutual funds shares capital capital | 13 200 | 14 192 | 14 883 | 14 776 | 15 323 | 14 453 | |||||||||||||||||||||||||||||||||||||||||||||||||||||||||||||||||||||||||
| Net purchases | 668 | 283 | 232 | -457 | -129 | -624 | |||||||||||||||||||||||||||||||||||||||||||||||||||||||||||||||||||||||||
| Financial corporations | |||||||||||||||||||||||||||||||||||||||||||||||||||||||||||||||||||||||||||||||
| Mutual funds shares capital | 148 129 | 170 074 | 185 298 | 200 007 | 208 157 | 200 329 | |||||||||||||||||||||||||||||||||||||||||||||||||||||||||||||||||||||||||
| Net purchases | 6 611 | 8 055 | 5 385 | 7 720 | 6 137 | -594 | |||||||||||||||||||||||||||||||||||||||||||||||||||||||||||||||||||||||||
| Non-financial corporations | |||||||||||||||||||||||||||||||||||||||||||||||||||||||||||||||||||||||||||||||
| Mutual funds shares capital | 38 126 | 42 350 | 46 513 | 50 666 | 53 989 | 49 309 | |||||||||||||||||||||||||||||||||||||||||||||||||||||||||||||||||||||||||
| Net purchases | 509 | -418 | 1 478 | 1 842 | 1 883 | -2 756 | |||||||||||||||||||||||||||||||||||||||||||||||||||||||||||||||||||||||||
| Households | |||||||||||||||||||||||||||||||||||||||||||||||||||||||||||||||||||||||||||||||
| Mutual funds shares capital | 84 844 | 101 221 | 112 277 | 122 332 | 129 397 | 119 764 | |||||||||||||||||||||||||||||||||||||||||||||||||||||||||||||||||||||||||
| Net purchases | 3 269 | 3 390 | 2 882 | 3 321 | 2 467 | -2 103 | |||||||||||||||||||||||||||||||||||||||||||||||||||||||||||||||||||||||||
| Rest of the world | |||||||||||||||||||||||||||||||||||||||||||||||||||||||||||||||||||||||||||||||
| Mutual funds shares capital | 28 852 | 38 476 | 48 415 | 60 958 | 67 282 | 62 573 | |||||||||||||||||||||||||||||||||||||||||||||||||||||||||||||||||||||||||
| Net purchases | 261 | 2 372 | 5 734 | 7 988 | 1 914 | -1 080 | |||||||||||||||||||||||||||||||||||||||||||||||||||||||||||||||||||||||||
Adjustments made in the mutual fund statistics due to nominee ownershipIn order to show the actual owners in mutual funds, adjustments have been made in the statistical material. This has caused a decrease in banks and financial auxiliaries’ owner share, while employees/households have had their owner share increased.
The adjustments, which include both owner positions and net purchases of mutual fund shares, have been made in all quarters dating back to the first quarter of 2008. In the statistics for the second quarter of 2010, owner positions of NOK 12 billion have been transferred to employees/households, of which NOK 5 billion was moved from banks and NOK 7 billion taken from financial auxiliaries.
Nominee - ownership is where parties other than the actual owners are registered in the investment companies’ registers. In this context, this means that banks and financial auxiliaries have been registered as owners on behalf of employees/households. |
Tables
The statistics is now published as Mutual funds.
Contact
-
Harald Stormoen
E-mail: harald.stormoen@ssb.no
tel.: (+47) 95 91 95 91
-
Steven Chun Wei Got
E-mail: steven.got@ssb.no
tel.: (+47) 90 82 68 27