Content
Published:
This is an archived release.
Lower share of fixed interest rates
The share of fixed interest rate loans to Norwegian employees from financial corporations fell in the 2nd quarter of 2010. The share fell in banks and in state lending institutions, and only marginally in mortgage companies.
The share of loans with fixed interest from financial corporations to Norwegian employees fell in the second quarter of 2010 by 0.05 percentage points to 6.7 per cent, and by 0.04 percentage points to 9.2 per cent respectively in households.
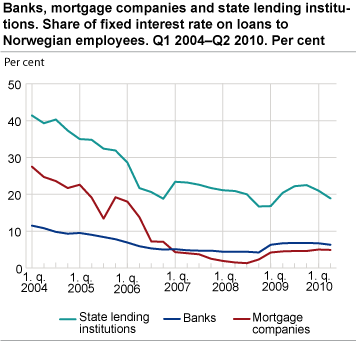

Lower share of fixed interest in banks and increased share in state lending institutions
The share of fixed interest loans to employees from banks fell by 0.4 percentage points to 6.3 per cent and by 2.1 percentage points in state lending institutions to 18.9 per cent in the second quarter of 2010. In mortgage companies the share of fixed interest loans to employees fell slightly by 0.01 percentage points to 4.9 per cent.
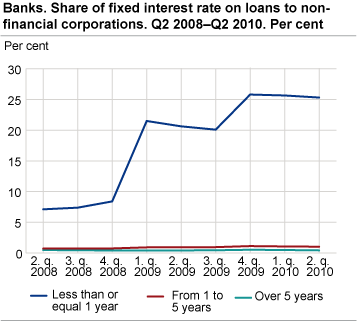
Shorter period of interest rate fixation
The share of loans with a remaining interest rate fixed term less than or equal to one year has increased since the outbreak of the financial crisis at the end of 2008. This share now seems to have stabilised at a somewhat higher level. One explanation for the increase in loans with a shorter interest rate fixed term may be increased uncertainty about the future interest rate level. Some of the changes at the end of 2008 are also explained by changes in portfolio and changes in reporting practice.
| Quarter | Banks | Mortgage companies | state lending institutions | Mean | |||||||||||||||||||||||||||||||||||||||||||||||||||||||||||||||||||||||||||
|---|---|---|---|---|---|---|---|---|---|---|---|---|---|---|---|---|---|---|---|---|---|---|---|---|---|---|---|---|---|---|---|---|---|---|---|---|---|---|---|---|---|---|---|---|---|---|---|---|---|---|---|---|---|---|---|---|---|---|---|---|---|---|---|---|---|---|---|---|---|---|---|---|---|---|---|---|---|---|---|
| Less than 1 year | 1 to 5 years | More than 5 years | total | Less than 1 year | 1 to 5 years | More than 5 years | total | Less than 1 year | 1 to 5 years | More than 5 years | total | Less than 1 year | 1 to 5 years | More than 5 years | total | ||||||||||||||||||||||||||||||||||||||||||||||||||||||||||||||||
| 30.06.2004 | 1.43 | 8.82 | 0.58 | 10.8 | 4.04 | 19.49 | 1.17 | 24.7 | 4.14 | 35.14 | 0.00 | 39.3 | 1.85 | 12.41 | 0.52 | 14.8 | |||||||||||||||||||||||||||||||||||||||||||||||||||||||||||||||
| 30.09.2004 | 1.28 | 8.05 | 0.50 | 9.8 | 3.77 | 18.76 | 1.05 | 23.6 | 5.57 | 34.71 | 0.00 | 40.3 | 1.87 | 11.59 | 0.46 | 13.9 | |||||||||||||||||||||||||||||||||||||||||||||||||||||||||||||||
| 31.12.2004 | 1.46 | 7.40 | 0.47 | 9.3 | 5.69 | 12.46 | 3.59 | 21.7 | 4.51 | 32.84 | 0.00 | 37.3 | 1.95 | 10.54 | 0.52 | 13.0 | |||||||||||||||||||||||||||||||||||||||||||||||||||||||||||||||
| 31.03.2005 | 1.95 | 7.05 | 0.55 | 9.5 | 6.84 | 12.09 | 3.65 | 22.6 | 10.80 | 24.17 | 0.00 | 35.0 | 3.13 | 9.19 | 0.58 | 12.9 | |||||||||||||||||||||||||||||||||||||||||||||||||||||||||||||||
| 30.06.2005 | 2.78 | 5.68 | 0.50 | 9.0 | 4.11 | 10.54 | 4.45 | 19.1 | 11.80 | 22.98 | 0.00 | 34.8 | 3.82 | 7.75 | 0.58 | 12.1 | |||||||||||||||||||||||||||||||||||||||||||||||||||||||||||||||
| 30.09.2005 | 3.27 | 4.62 | 0.51 | 8.4 | 3.20 | 6.87 | 3.35 | 13.4 | 11.38 | 21.06 | 0.00 | 32.4 | 4.13 | 6.45 | 0.55 | 11.1 | |||||||||||||||||||||||||||||||||||||||||||||||||||||||||||||||
| 31.12.2005 | 2.98 | 4.23 | 0.60 | 7.8 | 7.91 | 9.06 | 2.28 | 19.2 | 10.56 | 21.31 | 0.00 | 31.9 | 3.85 | 6.08 | 0.57 | 10.5 | |||||||||||||||||||||||||||||||||||||||||||||||||||||||||||||||
| 31.03.2006 | 2.30 | 4.02 | 0.53 | 6.9 | 7.85 | 8.19 | 1.95 | 18.0 | 10.16 | 18.40 | 0.00 | 28.6 | 3.22 | 5.60 | 0.50 | 9.3 | |||||||||||||||||||||||||||||||||||||||||||||||||||||||||||||||
| 30.06.2006 | 1.56 | 3.75 | 0.55 | 5.9 | 3.56 | 8.26 | 1.96 | 13.8 | 3.55 | 18.14 | 0.00 | 21.7 | 1.80 | 5.27 | 0.52 | 7.6 | |||||||||||||||||||||||||||||||||||||||||||||||||||||||||||||||
| 30.09.2006 | 1.30 | 3.49 | 0.55 | 5.3 | 1.69 | 4.34 | 1.14 | 7.2 | 3.06 | 17.52 | 0.00 | 20.6 | 1.49 | 4.88 | 0.51 | 6.9 | |||||||||||||||||||||||||||||||||||||||||||||||||||||||||||||||
| 31.12.2006 | 1.39 | 2.97 | 0.65 | 5.0 | 1.33 | 4.56 | 1.25 | 7.1 | 2.50 | 16.34 | 0.00 | 18.8 | 1.49 | 4.29 | 0.60 | 6.4 | |||||||||||||||||||||||||||||||||||||||||||||||||||||||||||||||
| 31.03.2007 | 1.43 | 2.93 | 0.74 | 5.1 | 0.74 | 2.63 | 0.92 | 4.3 | 1.39 | 21.98 | 0.00 | 23.4 | 1.40 | 4.61 | 0.68 | 6.7 | |||||||||||||||||||||||||||||||||||||||||||||||||||||||||||||||
| 30.06.2007 | 1.40 | 2.68 | 0.77 | 4.8 | 1.13 | 2.00 | 0.91 | 4.0 | 1.47 | 21.75 | 0.00 | 23.2 | 1.39 | 4.28 | 0.71 | 6.4 | |||||||||||||||||||||||||||||||||||||||||||||||||||||||||||||||
| 30.09.2007 | 1.44 | 2.53 | 0.73 | 4.7 | 1.18 | 1.60 | 0.88 | 3.7 | 2.76 | 19.87 | 0.00 | 22.6 | 1.54 | 3.92 | 0.68 | 6.1 | |||||||||||||||||||||||||||||||||||||||||||||||||||||||||||||||
| 31.12.2007 | 1.33 | 2.64 | 0.72 | 4.7 | 0.82 | 1.08 | 0.59 | 2.5 | 6.96 | 14.70 | 0.00 | 21.7 | 1.75 | 3.50 | 0.65 | 5.9 | |||||||||||||||||||||||||||||||||||||||||||||||||||||||||||||||
| 31.03.2008 | 1.10 | 2.61 | 0.71 | 4.4 | 0.62 | 0.83 | 0.46 | 1.9 | 7.07 | 14.01 | 0.01 | 21.1 | 1.54 | 3.38 | 0.63 | 5.5 | |||||||||||||||||||||||||||||||||||||||||||||||||||||||||||||||
| 30.06.2008 | 0.93 | 2.71 | 0.71 | 4.4 | 0.32 | 0.80 | 0.33 | 1.5 | 7.89 | 12.94 | 0.04 | 20.9 | 1.41 | 3.30 | 0.61 | 5.3 | |||||||||||||||||||||||||||||||||||||||||||||||||||||||||||||||
| 30.09.2008 | 0.79 | 2.88 | 0.73 | 4.4 | 0.22 | 0.78 | 0.32 | 1.3 | 6.47 | 13.47 | 0.08 | 20.0 | 1.15 | 3.37 | 0.61 | 5.1 | |||||||||||||||||||||||||||||||||||||||||||||||||||||||||||||||
| 31.12.2008 | 0.94 | 2.69 | 0.60 | 4.2 | 0.40 | 1.35 | 0.57 | 2.3 | 3.61 | 13.01 | 0.10 | 16.7 | 1.05 | 3.24 | 0.56 | 4.8 | |||||||||||||||||||||||||||||||||||||||||||||||||||||||||||||||
| 31.03.2009 | 1.24 | 4.38 | 0.72 | 6.3 | 0.34 | 3.16 | 0.69 | 4.2 | 3.27 | 13.41 | 0.10 | 16.8 | 1.20 | 4.82 | 0.66 | 6.7 | |||||||||||||||||||||||||||||||||||||||||||||||||||||||||||||||
| 30.06.2009 | 1.42 | 4.57 | 0.70 | 6.7 | 0.31 | 3.40 | 0.77 | 4.5 | 3.21 | 17.02 | 0.16 | 20.4 | 1.27 | 5.24 | 0.68 | 7.2 | |||||||||||||||||||||||||||||||||||||||||||||||||||||||||||||||
| 30.09.2009 | 1.34 | 4.79 | 0.72 | 6.8 | 0.29 | 3.56 | 0.72 | 4.6 | 2.32 | 19.68 | 0.19 | 22.2 | 1.11 | 5.58 | 0.68 | 7.4 | |||||||||||||||||||||||||||||||||||||||||||||||||||||||||||||||
| 31.12.2009 | 1.27 | 4.76 | 0.72 | 6.8 | 0.26 | 3.64 | 0.73 | 4.6 | 2.89 | 19.39 | 0.21 | 22.5 | 1.09 | 5.55 | 0.69 | 7.3 | |||||||||||||||||||||||||||||||||||||||||||||||||||||||||||||||
| 31.03.2010 | 1.69 | 4.38 | 0.67 | 6.7 | 0.23 | 4.06 | 0.73 | 5.0 | 2.08 | 18.72 | 0.22 | 21.0 | 1.19 | 5.37 | 0.66 | 7.2 | |||||||||||||||||||||||||||||||||||||||||||||||||||||||||||||||
| 30.06.2010 | 1.52 | 4.13 | 0.64 | 6.3 | 0.25 | 3.96 | 0.74 | 4.9 | 2.29 | 16.41 | 0.22 | 18.9 | 1.10 | 4.99 | 0.64 | 6.7 | |||||||||||||||||||||||||||||||||||||||||||||||||||||||||||||||
Fixed interest on loans in NorwayFixed interest rate loans give predictability for interest costs, and can be regarded as an insurance against increasing interest rates. There are several possible reasons for the traditionally low share of loans with fixed interest in Norway. Among other factors, it could be that borrowers consider fixed interest more of a speculation than insurance. Another reason could be that the Central bank’s projections for the key policy interest rate are clearly communicated to the market. |
SectorPensioners, social security recipients and students are included in the sector employees . |
The statistics is now published as Interest rates in banks and mortgage companies.
Additional information
This statistics show loans broken down by the remaining fixed interest rate period. The fixed interest rate period is measured as the time from the end of the reported period to the next interest rate regulation. Differences between figures in the text and the tables due to rounding off may occur.
Contact
-
Statistics Norway's Information Centre
E-mail: informasjon@ssb.no
tel.: (+47) 21 09 46 42