Content
Published:
This is an archived release.
Fixed interest share of loans still low
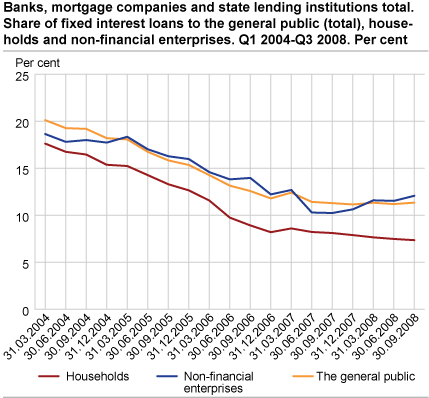
By the end of the third quarter 2008, the share of loans with a fixed interest rate to households fell to 7.4 per cent. The fixed interest rate share of loans to non-financial corporations increased slightly to 12.1 per cent.
The financial enterprises’ share of fixed interest rate loans out of total loans to the general public (non-financial corporations, municipalities and households) rose slightly to 12.1 per cent in the third quarter of 2008, up from 11.3 per cent in the previous quarter. By comparison, the share was 20.1 per cent in the first quarter of 2004.
Share of fixed interest loans to households continues to fall
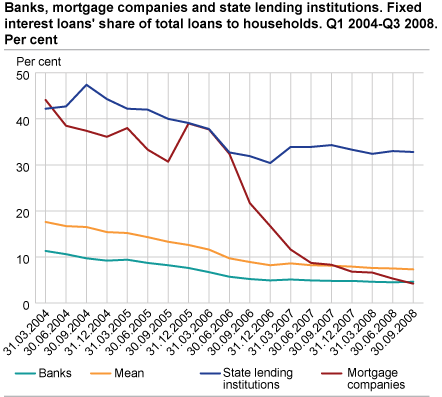
Apart from the first quarter of 2007, the share of fixed interest loans to households decreased in all quarters since these statistics started. Figures for the third quarter of 2008 show us that this trend continues. In the second quarter of 2004, the share was almost 17 per cent, but had fallen to only 7.4 per cent in the third quarter of 2008. The share of fixed interest rate loans to households from mortgage companies has fallen with 40 percentage points in this period while the share of fixed interest rate loans from state lending institutions and from banks has fallen more moderately.
The share of loans from banks, mortgage companies and state lending institutions with a fixed interest for one year or less fell from 2.4 per cent in the second quarter of 2008 to 2.2 per cent in the third quarter of 2008. The figures also show an increased share in fixed interest rate loans with longer contract periods. Fixed interest for 1-5 years rose from 4.2 per cent to 4.3 per cent, while fixed interest for 5 years or more rose from 0.8 per cent to 0.9 per cent from the second to the third quarter 2008.
| Quarter | Banks | Mortgage companies | State lending institutions | Mean | |||||||||||||||||||||||||||||||||||
|---|---|---|---|---|---|---|---|---|---|---|---|---|---|---|---|---|---|---|---|---|---|---|---|---|---|---|---|---|---|---|---|---|---|---|---|---|---|---|---|
| Less than 1 year | 1 to 5 years | More than 5 years | total | Less than 1 year | 1 to 5 years | More than 5 years | total | Less than 1 year | 1 to 5 years | More than 5 years | total | Less than 1 year | 1 to 5 years | More than 5 years | total | ||||||||||||||||||||||||
| Q1 2004 | 2.0 | 8.8 | 0.6 | 11.3 | 13.4 | 21.8 | 9.0 | 44.1 | 4.3 | 37.9 | 0.0 | 42.2 | 2.9 | 13.8 | 0.9 | 17.6 | |||||||||||||||||||||||
| Q2 2004 | 1.6 | 8.5 | 0.6 | 10.6 | 11.7 | 19.5 | 7.3 | 38.5 | 4.5 | 38.2 | 0.0 | 42.7 | 2.5 | 13.4 | 0.9 | 16.7 | |||||||||||||||||||||||
| Q3 2004 | 1.4 | 7.8 | 0.5 | 9.7 | 11.2 | 19.1 | 7.1 | 37.4 | 5.4 | 42.0 | 0.0 | 47.4 | 2.5 | 13.2 | 0.8 | 16.5 | |||||||||||||||||||||||
| Q4 2004 | 1.6 | 7.2 | 0.5 | 9.2 | 11.8 | 16.2 | 8.1 | 36.1 | 4.0 | 40.4 | 0.0 | 44.3 | 2.4 | 12.2 | 0.8 | 15.4 | |||||||||||||||||||||||
| Q1 2005 | 2.0 | 6.8 | 0.5 | 9.4 | 14.2 | 15.7 | 8.1 | 38.0 | 8.6 | 33.5 | 0.0 | 42.2 | 3.5 | 10.8 | 0.9 | 15.2 | |||||||||||||||||||||||
| Q2 2005 | 2.7 | 5.5 | 0.5 | 8.7 | 11.1 | 15.0 | 7.3 | 33.3 | 9.9 | 32.0 | 0.0 | 42.0 | 4.1 | 9.4 | 0.8 | 14.3 | |||||||||||||||||||||||
| Q3 2005 | 3.2 | 4.5 | 0.5 | 8.2 | 11.7 | 12.2 | 6.7 | 30.7 | 9.6 | 30.4 | 0.0 | 40.0 | 4.4 | 8.2 | 0.7 | 13.3 | |||||||||||||||||||||||
| Q4 2005 | 2.9 | 4.1 | 0.6 | 7.6 | 16.7 | 14.6 | 7.7 | 39.0 | 8.6 | 30.5 | 0.0 | 39.1 | 4.1 | 7.8 | 0.8 | 12.6 | |||||||||||||||||||||||
| Q1 2006 | 2.2 | 3.9 | 0.5 | 6.7 | 17.1 | 12.9 | 7.7 | 37.7 | 9.2 | 28.6 | 0.0 | 37.8 | 3.6 | 7.3 | 0.7 | 11.6 | |||||||||||||||||||||||
| Q2 2006 | 1.5 | 3.6 | 0.6 | 5.7 | 15.5 | 10.4 | 6.4 | 32.4 | 3.9 | 28.8 | 0.0 | 32.7 | 2.2 | 6.8 | 0.7 | 9.7 | |||||||||||||||||||||||
| Q3 2006 | 1.3 | 3.4 | 0.5 | 5.2 | 10.3 | 7.3 | 4.2 | 21.7 | 3.4 | 28.5 | 0.0 | 31.9 | 1.9 | 6.4 | 0.6 | 8.9 | |||||||||||||||||||||||
| Q4 2006 | 1.4 | 2.9 | 0.7 | 4.9 | 4.7 | 7.3 | 4.8 | 16.7 | 3.0 | 27.4 | 0.0 | 30.4 | 1.7 | 5.8 | 0.7 | 8.2 | |||||||||||||||||||||||
| Q1 2007 | 1.5 | 2.9 | 0.8 | 5.1 | 3.3 | 5.0 | 3.3 | 11.6 | 1.4 | 32.5 | 0.0 | 33.9 | 1.6 | 6.2 | 0.8 | 8.6 | |||||||||||||||||||||||
| Q2 2007 | 1.5 | 2.6 | 0.8 | 4.9 | 2.5 | 4.0 | 2.2 | 8.7 | 1.7 | 32.2 | 0.0 | 33.9 | 1.6 | 5.8 | 0.8 | 8.2 | |||||||||||||||||||||||
| Q3 2007 | 1.6 | 2.4 | 0.7 | 4.8 | 3.0 | 3.3 | 2.1 | 8.3 | 3.9 | 30.5 | 0.0 | 34.3 | 2.0 | 5.4 | 0.7 | 8.1 | |||||||||||||||||||||||
| Q4 2007 | 1.5 | 2.5 | 0.7 | 4.8 | 3.0 | 2.3 | 1.5 | 6.8 | 9.6 | 23.6 | 0.0 | 33.3 | 2.5 | 4.7 | 0.7 | 7.9 | |||||||||||||||||||||||
| Q1 2008 | 1.4 | 2.5 | 0.7 | 4.7 | 2.3 | 1.7 | 2.6 | 6.6 | 9.6 | 22.8 | 0.0 | 32.4 | 2.3 | 4.5 | 0.8 | 7.6 | |||||||||||||||||||||||
| Q2 2008 | 1.2 | 2.6 | 0.7 | 4.5 | 1.6 | 1.3 | 2.3 | 5.2 | 12.7 | 20.3 | 0.0 | 33.0 | 2.4 | 4.2 | 0.8 | 7.5 | |||||||||||||||||||||||
| Q3 2008 | 1.1 | 2.8 | 0.7 | 4.6 | 1.1 | 1.2 | 1.9 | 4.2 | 12.3 | 20.5 | 0.0 | 32.8 | 2.2 | 4.3 | 0.9 | 7.3 | |||||||||||||||||||||||
Increase for non-financial corporations
The fixed interest share of loans to non-financial corporations increased by 0.5 percentage points in the third quarter of 2008 to 12.1 per cent. This is the highest share of fixed interest rate loans for this sector since the first quarter of 2007.
It can be interesting to look at the fixed interest share of loans and the remaining fixed period. In the third quarter of 2008, there is an increase in loans with fixed interest for 5 years or more for non-financial corporations and such loans have a share of 15.8 per cent of all loans with fixed interest rate. This share rose by 1.1 percentage points compared to the previous quarter. Fixed periods of one year or less still dominate the lending profile and amount to 75 per cent of all fixed interest rate loans for non-financial corporations.
Unaltered share of loans from banks, decreasing share for mortgage companies
The statistics include all loans from banks, mortgage companies and state lending institutions. When comparing the different creditor sectors’ share of fixed interest rate loans to the general public, it is evident that the banks’ share of ficed interest rate loans has fallen in all quarters before levelling out in the third quarter of 2007. The share has increased in the two succeeding quarters, and by the end of the third quarter of 2008 the share was 6.1 per cent.
Mortgage companies’ share of fixed interest rate loans has decreased in most quarters since 2004. By the end of the third quarter of 2008, the share was 24.1 per cent; a decrease of 2.9 percentage points from the previous quarter. The decrease in the mortgage companies’ share of fixed interest rate loans is largely due to portfolio movements of housing loans with floating interest rates from banks to mortgage companies within the same company group. Such portfolio movements have become more common as a consequence of the new regulations for bonds with right of priority, which were introduced on 1 June 2007.
Local government chooses fixed interest rate
The share of fixed interest rate loans to local government is high and has remained between 40 and 50 per cent since 2004. In the third quarter of 2008, the share was 48.5 per cent; up 0.5 percentage points from the second quarter.
Increase for the state banks
State lending institutions, often referred to as state banks, still have a relatively high share of fixed interest rate loans to the general public. At the end of the third quarter 2008, the state banks’ share of fixed interest rate loans to the general public was almost 35 per cent.
The statistics is now published as Interest rates in banks and mortgage companies.
Additional information
This statistics show loans broken down by the remaining fixed interest rate period. The fixed interest rate period is measured as the time from the end of the reported period to the next interest rate regulation. Differences between figures in the text and the tables due to rounding off may occur.
Contact
-
Statistics Norway's Information Centre
E-mail: informasjon@ssb.no
tel.: (+47) 21 09 46 42


