Content
Published:
This is an archived release.
Decrease in money supply growth
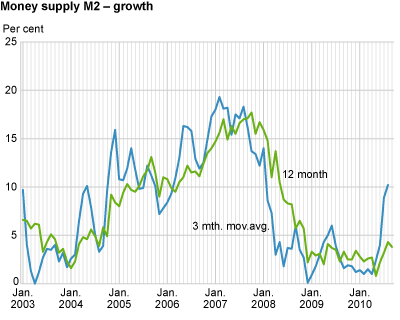
The twelve-month growth in total money supply (M2) was 3.8 per cent to end-September, down from 4.3 per cent to end-August. The decrease was mainly caused by other financial enterprises. Households’ money supply growth increased.
The total money supply amounted to NOK 1 567 billion by end-September, down from NOK 1 577 billion by end-August.
Sharp decrease in other financial enterprises’ money supply growth
Other financial enterprises’ money supply (other than state lending institutions, banks and money market funds) amounted to NOK 142 billion at end-September, down from NOK 152 billion the previous month. The twelve-month growth was 5.7 per cent to end-September, down from 18.2 per cent to end-August.
Decrease also for non-financial enterprises
Non-financial enterprises’ money supply amounted to NOK 512 billion at end-September, down from NOK 514 billion at end-August. The twelve-month growth was 1.0 per cent to end-September, down from 1.2 per cent to end-August. Non-financial enterprises’ money supply constituted 43 per cent of their gross domestic debt measured by the credit indicator C2 .
Increase in households’ money supply growth
Households’ money supply amounted to NOK 852 billion by end-September, down from NOK 854 billion to the previous month. This constituted more than half of the total money supply. The twelve-month growth in households’ money supply was 4.6 per cent to end-September, up from 4.2 per cent to end-August. This is the highest twelve-month growth measured for households since November 2009. The growth in households’ money supply was lower than the growth in households’ gross domestic debt, which was 6.3 per cent to end-September, according to the credit indicator C2 . For more information on the financial position of households, see the financial accounts in the national accounts .
| April 2010 | May 2010 | June 2010 | July 2010 | August 2010 | September 2010 | ||||||||||||||||||||||||||||||||||||||||||||||||||||||||||||||||||||||||||
|---|---|---|---|---|---|---|---|---|---|---|---|---|---|---|---|---|---|---|---|---|---|---|---|---|---|---|---|---|---|---|---|---|---|---|---|---|---|---|---|---|---|---|---|---|---|---|---|---|---|---|---|---|---|---|---|---|---|---|---|---|---|---|---|---|---|---|---|---|---|---|---|---|---|---|---|---|---|---|---|
| M0 - 12 mth. | -23.5 | -22.4 | -31.2 | -31.3 | -5.7 | 1.0 | |||||||||||||||||||||||||||||||||||||||||||||||||||||||||||||||||||||||||
| M1 - 12 mth. | 2.7 | -0.9 | 0.3 | 1.6 | 2.2 | 2.1 | |||||||||||||||||||||||||||||||||||||||||||||||||||||||||||||||||||||||||
| M2 - 12 mth. | 2.7 | 0.8 | 2.2 | 3.2 | 4.3 | 3.8 | |||||||||||||||||||||||||||||||||||||||||||||||||||||||||||||||||||||||||
| M2 - 3 mth. moving average | 1.0 | 2.4 | 4.0 | 8.9 | 10.2 | ||||||||||||||||||||||||||||||||||||||||||||||||||||||||||||||||||||||||||
| M2 households - 12 mth. | 4.0 | 3.4 | 3.8 | 4.4 | 4.2 | 4.6 | |||||||||||||||||||||||||||||||||||||||||||||||||||||||||||||||||||||||||
| M2 non-financial enterprises - 12 mth. | -0.6 | -4.6 | -2.9 | -1.6 | 1.2 | 1.0 | |||||||||||||||||||||||||||||||||||||||||||||||||||||||||||||||||||||||||
Composition of money supply
The broad monetary aggregate M2 amounted to NOK 1 567 billion at end-September, of which the major part, 91.3 per cent, consisted of bank deposits. In comparison, notes and coins only accounted for 2.9 per cent. The rest of the broad money mainly consisted of shares in money market funds and certificates of deposits, which accounted for 5.4 and 0.4 per cent respectively.
|
The money supply (broad monetary aggregate) M2 consists of notes and coins, unrestricted bank deposits, certificates of deposit and units in money market funds owned by the money-holding sector, i.e. households, non-financial enterprises, municipalities and financial enterprises other than state lending institutions, banks and money market funds. |
|
Growth based on the three-month moving average is defined as growth in average money supply (seasonally-adjusted figures) in the latest three-month period in relation to the previous three-month period. The growth is adjusted for exchange rate valuation changes and statistical breaks as an annualised figure. The calculation is centred; in other words, the observation is set at the middle month of the latest three-month period. |
Tables
The statistics is published with Monetary aggregates.
Contact
-
Statistics Norway's Information Centre
E-mail: informasjon@ssb.no
tel.: (+47) 21 09 46 42