Content
Published:
This is an archived release.
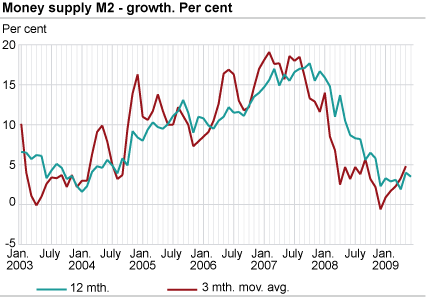
Reduced money supply growth
The twelve-month growth in total money supply was 3.5 per cent to end-June, down from 4 per cent to end-May. The increase in the M2 growth came from enterprises (both other financial and non-financial enterprises).
The money supply amounted to NOK 1 532 billion at end-June, up from NOK 1 503 billion at end-May.
Weak growth in non-financial enterprise money supply
Non-financial enterprise money supply amounted to NOK 508 billion at end-June. The twelve-month growth was 1.6 per cent to end-June, down from 2.7 per cent to the previous month. The growth in non-financial enterprise money supply was positive for the second month in a row after having been negative during the whole period November 2008 - April 2009. Non-financial enterprise money supply constituted 42 per cent of their gross domestic debt measured by the credit indicator C2 at end-May. As recently as in December 2007 this ratio was higher than 50 per cent.
Continued negative growth in other financial enterprise money supply
Other financial enterprise money supply (other than state lending institutions, banks and money market funds) amounted to NOK 126 billion at end-June. The twelve-month growth was -7.1 per cent to end-June, down from -3.7 per cent to the previous month.
Reduced growth in household money supply
At end-June, more than half (NOK 832 billion) of the broad monetary aggregate was owned by households. The twelve-month growth in household money supply was 5.9 per cent to end-June, down from 6.2 per cent to the previous month. The growth in household money supply was lower than the growth in household gross domestic debt, which was 6.4 per cent to end-June, as shown by the credit indicator C2 . For more information on the financial position of households, see the financial accounts in the national accounts .
| January 2009 | February 2009 | March 2009 | April 2009 | May 2009 | June 2009 | ||||||||||||||||||||||||||||||||||
|---|---|---|---|---|---|---|---|---|---|---|---|---|---|---|---|---|---|---|---|---|---|---|---|---|---|---|---|---|---|---|---|---|---|---|---|---|---|---|---|
| M0 - 12 mth. | 103.4 | 147.1 | 39.1 | 80.6 | 72.1 | 59.1 | |||||||||||||||||||||||||||||||||
| M1 - 12 mth. | -4.5 | -4.0 | -4.0 | -4.5 | -1.3 | -1.9 | |||||||||||||||||||||||||||||||||
| M2 - 12 mth. | 3.3 | 2.9 | 3.1 | 1.9 | 4.0 | 3.5 | |||||||||||||||||||||||||||||||||
| M2 - 3 mth. moving average | 0.9 | 1.7 | 2.3 | 3.3 | 4.8 | ||||||||||||||||||||||||||||||||||
| M2 households - 12 mth. | 7.5 | 7.2 | 6.8 | 6.2 | 6.2 | 5.9 | |||||||||||||||||||||||||||||||||
| M2 non-financial enterprises - 12 mth. | -1.1 | -3.1 | -0.6 | -0.8 | 2.7 | 1.6 | |||||||||||||||||||||||||||||||||
Composition of money supply
The broad monetary aggregate M2 amounted to NOK 1 532 billion at end-June, of which the major part (90.7 per cent) consisted of bank deposits. In comparison, notes and coins only accounted for 3 per cent of the broad money. The rest of the broad money mainly consisted of shares in money market funds (5.6 per cent), while certificates of deposits accounted for 0.7 per cent.
|
The money supply (broad monetary aggregate) M2 consists of notes and coins, unrestricted bank deposits, certificates of deposit and units in money market funds owned by the money-holding sector i.e. households, non-financial enterprises, municipalities and financial enterprises other than state lending institutions, banks and money market funds. |
The statistics is published with Monetary aggregates.
Contact
-
Statistics Norway's Information Centre
E-mail: informasjon@ssb.no
tel.: (+47) 21 09 46 42