Content
Published:
This is an archived release.
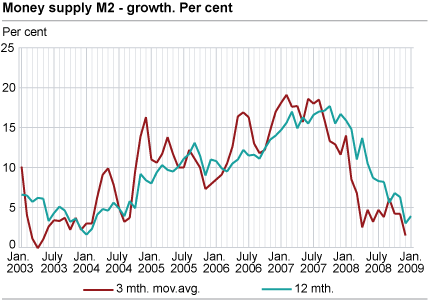
Increased growth in money supply
The twelve-month growth in total money supply was 3.9 per cent to end-January, up from 3.0 per cent to end-December. Most of the increase in the M2 growth came from non-financial enterprises.
The money supply amounted to NOK 1 514 billion at end-January, up from NOK 1 505 billion at end- December. The growth in money supply decreased almost through the whole of 2008.
Increasing growth for non-financial enterprise money supply
Non-financial enterprise money supply amounted to NOK 523 billion at end-January. The twelve-month growth was -0.1 per cent, up from -4.1 per cent to the previous month. Non-financial enterprise money supply constituted 44 per cent of their gross domestic debt measured by the credit indicator C2 at end-January.
Other financial enterprise and household money supply pulls down the growth
The twelve-month growth for other financial enterprise money supply (other than state lending institutions, banks and money market funds) was -1.2 per cent to end-January, down from 2.9 per cent to end-December. This decrease in growth is connected to the rise in these bank deposits in January 2008 (basis effect). Other financial enterprise money supply amounted to NOK 141 billion at end-January.
At end-January, more than half (NOK 804 billion) of the broad monetary aggregate was owned by households. The twelve-month growth in household money supply decreased from 8.9 per cent to 8.3 per cent during January. The growth in household money supply was higher than the growth in household gross domestic debt, which was 6.8 per cent to end-January, as shown by the credit indicator C2 . For more information on the financial position of households, see the financial accounts in the national accounts .
| August 2008 | September 2008 | October 2008 | November 2008 | December 2008 | January 2009 | ||||||||||||||||||||||||||||||||||
|---|---|---|---|---|---|---|---|---|---|---|---|---|---|---|---|---|---|---|---|---|---|---|---|---|---|---|---|---|---|---|---|---|---|---|---|---|---|---|---|
| M0 - 12 mth. | 16.4 | 21.6 | 59.8 | 115.8 | 43.0 | 103.4 | |||||||||||||||||||||||||||||||||
| M1 - 12 mth. | 2.8 | -2.4 | -3.9 | -4.2 | -5.3 | -4.5 | |||||||||||||||||||||||||||||||||
| M2 - 12 mth. | 8.2 | 5.6 | 6.8 | 6.3 | 3.0 | 3.9 | |||||||||||||||||||||||||||||||||
| M2 - 3 mth. moving average | 3.8 | 6.1 | 4.2 | 4.2 | 1.5 | ||||||||||||||||||||||||||||||||||
| M2 households - 12 mth. | 8.0 | 6.9 | 7.5 | 7.7 | 8.9 | 8.3 | |||||||||||||||||||||||||||||||||
| M2 non-financial enterprises - 12 mth. | 3.6 | 2.6 | 0.5 | -0.5 | -4.1 | -0.1 | |||||||||||||||||||||||||||||||||
Composition of money supply
The broad monetary aggregate M2 amounted to NOK 1 514 billion at end-January, of which the major part (89.7 per cent) consisted of bank deposits. In comparison, notes and coins only accounted for 3.0 per cent of the broad money. The rest of the broad money mainly consisted of shares in money market funds (6.5 per cent), while certificates of deposits accounted for 0.7 per cent.
|
Revision of data
|
|
The money supply (broad monetary aggregate) M2 consists of notes and coins, unrestricted bank deposits, certificates of deposit and units in money market funds owned by households, non-financial enterprises, municipalities and financial enterprises other than state lending institutions, banks and money market funds. |
The statistics is published with Monetary aggregates.
Contact
-
Statistics Norway's Information Centre
E-mail: informasjon@ssb.no
tel.: (+47) 21 09 46 42