Content
Published:
This is an archived release.
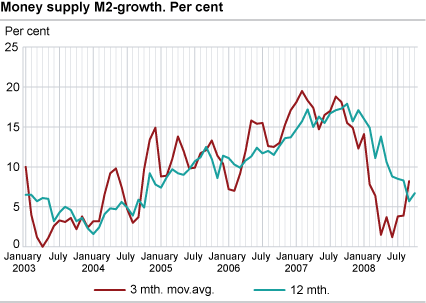
Increased growth in money supply
The twelve-month growth in total money supply was 6.7 per cent to end-October, up from 5.7 per cent to end- September. Most of the increase in the M2 growth came from other financial enterprises and households.
The money supply amounted to NOK 1 502 billion at end-October, up from NOK 1 461 billion at end-September. After a slowdown period from May to September the money supply growth rose in October.
Rise in other financial enterprise money supply growth
The twelve-month growth for other financial enterprise money supply (other than state lending institutions, banks and money market funds) was 31.3 per cent in October, up from 15.1 per cent in September. Other financial enterprise money supply amounted to NOK 159 billion at end-October, which is the highest amount ever recorded. That financial corporations have invested in liquid bank deposit can be related the financial crisis. The table of monetary base (M0) shows that banks had invested NOK 94 billion in current account with Norges Bank at end-October.
Increasing growth also for household money supply
At end-October more than half (NOK 782 billion) of the broad monetary aggregate was owned by households. The twelve-month growth in household money supply increased from 7.2 per cent to 7.7 per cent during October. Households have been the main contributor to annual growth in money supply for ten consecutive months. The growth in household money supply was a little lower than the growth in household gross debt, which was 8.2 per cent to end-October, as shown by the credit indicator C2 . For more information on the financial position of households, see the financial accounts in the national accounts .
Decrease for non-financial enterprise money supply growth
Non-financial enterprise money supply amounted to NOK 509 billion at end-October. The twelve-month growth was 0.4 per cent, compared with a yearly growth of 2.8 per cent recorded in the previous month. The twelve-month growth rate has not been lower since October 2004. Non-financial enterprise money supply constituted 43 per cent of their gross domestic debt measured by the credit indicator C2 at end-October.
| May 2008 | June 2008 | July 2008 | August 2008 | September 2008 | October 2008 | ||||||||||||||||||||||||||||||||||
|---|---|---|---|---|---|---|---|---|---|---|---|---|---|---|---|---|---|---|---|---|---|---|---|---|---|---|---|---|---|---|---|---|---|---|---|---|---|---|---|
| M0 - 12 mth. | 22.2 | 17.7 | 4.2 | 16.4 | 21.6 | 59.8 | |||||||||||||||||||||||||||||||||
| M1 - 12 mth. | 4.8 | 3.4 | 1.6 | 2.7 | -2.6 | -4.3 | |||||||||||||||||||||||||||||||||
| M2 - 12 mth. | 10.6 | 8.8 | 8.5 | 8.3 | 5.7 | 6.7 | |||||||||||||||||||||||||||||||||
| M2 - 3 mth. moving average | 3.7 | 1.2 | 3.8 | 3.9 | 8.2 | ||||||||||||||||||||||||||||||||||
| M2 households - 12 mth. | 9.5 | 8.6 | 8.2 | 8.2 | 7.2 | 7.7 | |||||||||||||||||||||||||||||||||
| M2 non-financial enterprises - 12 mth. | 6.4 | 4.2 | 4.1 | 3.9 | 2.8 | 0.4 | |||||||||||||||||||||||||||||||||
|
The money supply (broad monetary aggregate) M2 consists of notes and coins, unrestricted bank deposits, certificates of deposit and units in money market funds owned by households, non-financial enterprises, municipalities and financial enterprises other than state lending institutions, banks and money market funds. |
The statistics is published with Monetary aggregates.
Contact
-
Statistics Norway's Information Centre
E-mail: informasjon@ssb.no
tel.: (+47) 21 09 46 42