Content
Published:
This is an archived release.
Increase in total debt growth
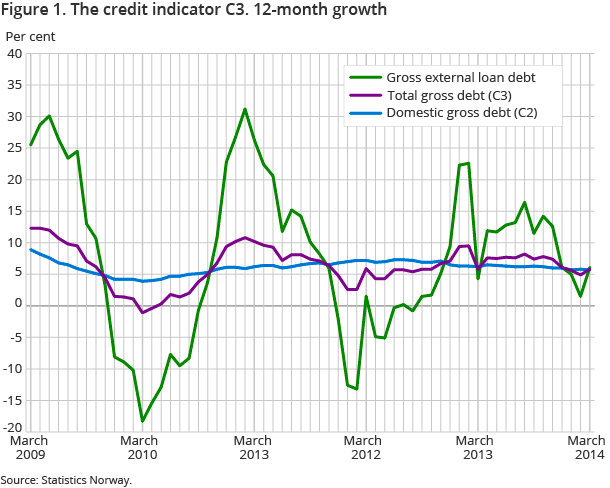
The twelve-month growth in total gross debt (C3) was 5.8 per cent to end-March, up from 4.9 per cent the previous month. The increase stemmed from foreign debt sources.
| March 2014 | February 2014 | January 2014 | December 2013 | November 2013 | October 2013 | |
|---|---|---|---|---|---|---|
| Total gross debt (C3) | 5.8 | 4.9 | 5.6 | 6.1 | 7.4 | 7.8 |
| Total gross loan debt, offshore ind. | 8.4 | 2.7 | 6.5 | 5.8 | 14.4 | 18.3 |
| Total gross loan debt, mainland-Norway | 5.4 | 5.2 | 5.4 | 6.1 | 6.3 | 6.3 |
| Domestic gross debt (C2) | 5.7 | 5.8 | 5.7 | 6.0 | 6.0 | 6.2 |
| Gross external loan debt | 6.1 | 1.5 | 5.0 | 6.1 | 12.6 | 14.2 |
| Gross external loan debt, offshore ind. | 12.4 | 4.4 | 9.9 | 9.1 | 21.8 | 27.2 |
| Gross external loan debt, mainland-Norway | 1.0 | -1.1 | 0.9 | 3.7 | 4.8 | 4.1 |

Total gross debt amounted to NOK 5 625 billion at end-March, up from NOK 5 609 billion at end-February.
Mainland Norway’s gross debt accounted for 87 per cent of the total gross debt at end-March. This amounted to NOK 4 879 billion, up from NOK 4 857 billion at end-February.
Stronger foreign debt growth
The general public gross foreign debt, which mainly relates to non-financial corporations, amounted to NOK 1 206 billion at end-March, marginally down from NOK 1 207 billion the previous month. The twelve-month growth increased from 1.5 per cent to end-February to 6.1 per cent to end-March.
Mainland Norway accounted for 53 per cent of the public gross foreign debt, which amounted to NOK 636 billion at end-March. The twelve-month growth in mainland Norway’s foreign debt was 1.0 per cent to end-March, up from -1.1 per cent to end-February. The increase in mainland Norway’s foreign debt stemmed from long-term debt.
Offshore industries accounted for the remainder of the foreign debt, which amounted to NOK 569 billion at end-March. The twelve-month growth was 12.4 per cent to end-March, up from 4.4 per cent to end-February. The increase in the twelve-month growth rate for the offshore industries stemmed from short-term debt.
Weaker domestic debt growth in March
The credit indicator (C2) amounted to NOK 4 419 billion at end-March. The twelve-month growth was 5.7 per cent to end-March, moderately down from 5.8 per cent the month before. The debt growth in non-financial corporations was 3.2 per cent to end-March, while the growth in household debt was 6.9 per cent in the same period. The C2 statistics show that the twelve-month growth in the general public domestic debt fell to 5.6 per cent to end-April.
Revised data for the foreign debtOpen and readClose
Transactions and growth rates for the foreign debt have been adjusted as a result of corrections within the period January 2013-January 2014.
The statistics is now published as Credit indicator.
Contact
-
Statistics Norway's Information Centre
E-mail: informasjon@ssb.no
tel.: (+47) 21 09 46 42
