Content
Published:
This is an archived release.
Continued drop in external loan debt
The twelve-month growth in public gross external loan debt was -8.2 per cent to end-February, up from -8.7 per cent to end-January. This is due to the large decrease in external loan debt in February last year compared to February this year.
The general public gross external loan debt, which mainly relates to non-financial enterprises, decreased from NOK 671 billion to NOK 670 billion in February. Offshore industries accounted for 40 per cent of the external loan debt. For this part of the foreign debt, the annual growth decreased from -17.4 per cent to -19.0 per cent in February. The whole decrease came from short-term debt.
The twelve-month growth in the foreign debt of mainland Norway went up from -2.4 per cent to -0.4 per cent during February. Almost the whole increase came from long-term debt. The external loan debt for this part of the economy amounted to NOK 404 billion at end-February.
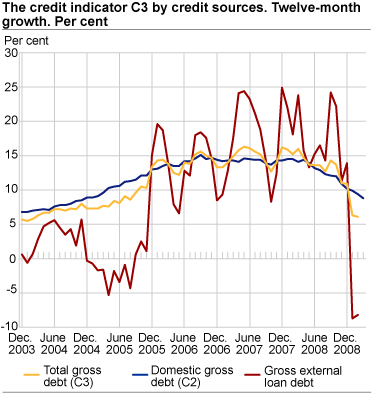
Slowdown in total gross debt growth
The twelve-month growth in total gross debt (C3) was 6.1 per cent to end-February, down from 6.3 per cent to end-January. Total gross debt amounted to NOK 4 006 billion at end-February, up from NOK 3 985 billion at end-January. About 90 per cent of the gross debt came from mainland Norway.
Decline in domestic gross debt growth
The credit indicator C2 amounted to NOK 3 336 billion at end-February. The twelve-month growth was 9.4 per cent, down from 9.9 per cent in the previous month. The debt growth in non-financial enterprise was 13.2 per cent, while the growth in household debt was 6.7 per cent. The C2 statistics show that the annual growth in the general public domestic gross debt continued to fall to 8.8 per cent to end-March this year.
| September 2008 | October 2008 | November 2008 | December 2008 | January 2009 | February 2009 | ||||||||||||||||||||||||||||||||||
|---|---|---|---|---|---|---|---|---|---|---|---|---|---|---|---|---|---|---|---|---|---|---|---|---|---|---|---|---|---|---|---|---|---|---|---|---|---|---|---|
| Total gross debt (C3) | 14.3 | 13.7 | 11.0 | 10.9 | 6.3 | 6.1 | |||||||||||||||||||||||||||||||||
| Domestic gross debt (C2)1 | 12.1 | 12.0 | 10.9 | 10.2 | 9.9 | 9.4 | |||||||||||||||||||||||||||||||||
| Gross external loan debt | 24.2 | 22.2 | 11.3 | 13.9 | -8.7 | -8.2 | |||||||||||||||||||||||||||||||||
| Gross external loan debt, offshore ind. | 47.3 | 42.1 | 16.6 | 19.8 | -17.4 | -19.0 | |||||||||||||||||||||||||||||||||
| Gross ext. loan debt, mainland-Norway | 6.9 | 9.7 | 8.0 | 9.0 | -2.4 | -0.4 | |||||||||||||||||||||||||||||||||
| 1 | The growth rates for C2 are in the table presented as they were at the time of the C3 release. |
|
The statistics for external loan debt are based on samples, and therefore associated with more uncertainty than the statistics for domestic debt (C2). For more details concerning sampling, see chapter 3.3 in About the statistics . |
|
C3 is an approximate measure of the size of the total gross debt of the public (households, non-financial enterprises and municipalities) in NOK and foreign exchange. C3 comprises the sum of C2 (the public’s domestic gross debt) and the public’s external loan debt of which C2 constitutes the largest part. The C3 statistics are published approximately one month later than C2. It should be noted that the growth rates for the public’s gross external loan debt vary from month to month due to shifting amounts of short-time internal debt by oil companies. In addition, the first-time-published growth rates are often revised at a later date due to improved information. For more details concerning the public’s gross external loan debt see StatBank. |
The statistics is now published as Credit indicator.
Contact
-
Statistics Norway's Information Centre
E-mail: informasjon@ssb.no
tel.: (+47) 21 09 46 42