Content
Published:
This is an archived release.
Increase in total debt growth
The twelve-month growth in total gross debt (C3) was 5.5 per cent to end-June, up from 3.9 per cent the previous month. The decrease stemmed from both domestic and foreign debt sources.
Total gross debt (C3) amounted to NOK 4 970 billion at end-June, up from NOK 4 922 billion at end-May.
Mainland Norway’s gross debt accounted for 87 per cent of the total gross debt at end-June. This amounted to NOK 4 304 billion at end-June, up from NOK 4 278 billion the previous month.
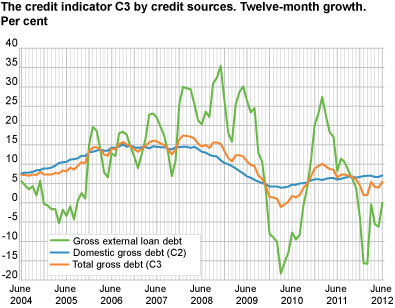
Foreign debt unchanged
The general public gross foreign debt, which mainly relates to non-financial enterprises, amounted to NOK 987 billion at end-June, up from NOK 965 billion the previous month. The annual growth in foreign debt to end-June increased by 6.2 percentage points from the previous month.
Mainland Norway accounted for 49.7 per cent of the public gross foreign debt, which amounted to NOK 490 billion at end-June. The twelve-month growth in mainland Norway’s foreign debt was -2.6 per cent to end-June, up from -5.6 per cent to end-May. The increase in mainland Norway’s foreign debt stemmed from long-term debt.
Offshore industries accounted for the remainder of the foreign debt, and amounted to NOK 496 billion at end-June. The annual growth climbed from -6.9 per cent to end-May to 2.8 per cent to end-June. The increase in the annual growth rate for the offshore industries stemmed from short-term debt.
Increase in domestic gross debt growth
The credit indicator (C2) amounted to NOK 3 984 billion at end-June. The twelve-month growth increased from 6.7 per cent to end-May to 7.1 per cent to end-June. The debt growth in non-financial enterprises was 6.7 per cent, while the growth in household debt was 7.1 per cent. The C2 statistics show that the annual growth in the general public domestic gross debt decreased from 7.1 per cent to end-June to 6.9 per cent to end-July.
| Dec. 2011 | Jan. 2012 | Feb. 2012 | March 2012 | April 2012 | May 2012 | June 2012 | |||||||||||||||||||||||||||||||||||||||||||||||||||||||||||||||||||||||||
|---|---|---|---|---|---|---|---|---|---|---|---|---|---|---|---|---|---|---|---|---|---|---|---|---|---|---|---|---|---|---|---|---|---|---|---|---|---|---|---|---|---|---|---|---|---|---|---|---|---|---|---|---|---|---|---|---|---|---|---|---|---|---|---|---|---|---|---|---|---|---|---|---|---|---|---|---|---|---|---|
| Total gross debt (C3) | 4.5 | 2.0 | 2.0 | 5.4 | 4.1 | 3.9 | 5.5 | ||||||||||||||||||||||||||||||||||||||||||||||||||||||||||||||||||||||||
| Total gross loan debt, mainland-Norway | 5.2 | 4.4 | 4.4 | 5.9 | 5.7 | 5.2 | 5.8 | ||||||||||||||||||||||||||||||||||||||||||||||||||||||||||||||||||||||||
| Domestic gross debt (C2)1 | 6.7 | 6.9 | 7.0 | 7.0 | 6.7 | 6.7 | 7.1 | ||||||||||||||||||||||||||||||||||||||||||||||||||||||||||||||||||||||||
| Gross external loan debt | -3.6 | -15.6 | -15.8 | -0.4 | -5.5 | -6.2 | 0.0 | ||||||||||||||||||||||||||||||||||||||||||||||||||||||||||||||||||||||||
| Gross external loan debt, offshore ind. | -1.3 | -18.9 | -18.5 | 2.7 | -8.9 | -6.9 | 2.8 | ||||||||||||||||||||||||||||||||||||||||||||||||||||||||||||||||||||||||
| Gross ext. loan debt, mainland-Norway | -5.4 | -12.9 | -13.6 | -3.2 | -2.2 | -5.6 | -2.6 | ||||||||||||||||||||||||||||||||||||||||||||||||||||||||||||||||||||||||
| 1 | The growth rates for C2 are in the table presented as they were at the time of the C3 release. |
The statistics is now published as Credit indicator.
Contact
-
Statistics Norway's Information Centre
E-mail: informasjon@ssb.no
tel.: (+47) 21 09 46 42