Content
Published:
This is an archived release.
Strong decrease in total debt growth
The twelve-month growth in total gross debt (C3) was 1.6 per cent to end-January, down from 4 per cent to the previous month. The decrease stemmed from foreign debt sources.
Total gross debt amounted to NOK 4 745 billion at end-January, down from NOK 4 814 billion at end-December.
Mainland Norway’s gross debt accounted for 88.5 per cent of the total gross debt at end-January. This amounted to NOK 4 197 billion at end-January, almost unchanged from the previous month.
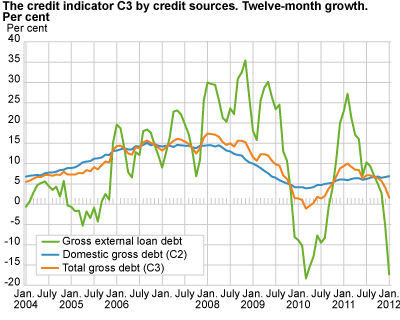
Decrease in foreign debt for both mainland Norway and offshore industries
The general public gross foreign debt, which mainly relates to non-financial enterprises, amounted to NOK 860 billion at end-January. The twelve-month growth decreased from -5.9 per cent to -17.3 per cent during January.
Mainland Norway accounted for about 56 per cent of the public gross foreign debt, which amounted to NOK 480 billion. The twelve-month growth in mainland Norway’s foreign debt was -16.2 per cent to end-January, down from -9.7 per cent to end-December. The decrease in mainland Norway’s foreign debt stemmed from both short and long-term debt.
Offshore industries accounted for the remainder of the foreign debt, and amounted to NOK 380 billion at end-January. The annual growth decreased from -1.2 per cent the previous month to -18.6 per cent to end-January. The decrease stemmed from both short and long-term debt.
Increase in domestic gross debt growth
The credit indicator (C2) amounted to NOK 3 884 billion at end-January. The twelve-month growth was 6.9 per cent to end-January, up from 6.7 per cent the previous month. The debt growth in non-financial enterprises was 5.8 per cent, while the growth in household debt was 7.2 per cent. The C2 statistics show that the annual growth in the general public domestic gross debt went up to 7 per cent to end-February.
| July 2011 | August 2011 | September 2011 | October 2011 | November 2011 | December 2011 | January 2012 | |||||||||||||||||||||||||||||||||||||||||||||||||||||||||||||||||||||||||
|---|---|---|---|---|---|---|---|---|---|---|---|---|---|---|---|---|---|---|---|---|---|---|---|---|---|---|---|---|---|---|---|---|---|---|---|---|---|---|---|---|---|---|---|---|---|---|---|---|---|---|---|---|---|---|---|---|---|---|---|---|---|---|---|---|---|---|---|---|---|---|---|---|---|---|---|---|---|---|---|
| Total gross debt (C3) | 7.1 | 7.1 | 6.7 | 6.4 | 5.7 | 4.0 | 1.6 | ||||||||||||||||||||||||||||||||||||||||||||||||||||||||||||||||||||||||
| Total gross loan debt, mainland-Norway | 5.2 | 5.3 | 5.2 | 5.2 | 4.1 | 4.6 | 3.9 | ||||||||||||||||||||||||||||||||||||||||||||||||||||||||||||||||||||||||
| Domestic gross debt (C2)1 | 6.2 | 6.5 | 6.7 | 6.8 | 6.5 | 6.7 | 6.9 | ||||||||||||||||||||||||||||||||||||||||||||||||||||||||||||||||||||||||
| Gross external loan debt | 10.3 | 9.4 | 7.0 | 5.0 | 2.7 | -5.9 | -17.3 | ||||||||||||||||||||||||||||||||||||||||||||||||||||||||||||||||||||||||
| Gross external loan debt, offshore ind. | 30.0 | 28.7 | 22.9 | 20.1 | 23.1 | -1.2 | -18.6 | ||||||||||||||||||||||||||||||||||||||||||||||||||||||||||||||||||||||||
| Gross ext. loan debt, mainland-Norway | -3.6 | -4.4 | -4.8 | -6.5 | -12.1 | -9.7 | -16.2 | ||||||||||||||||||||||||||||||||||||||||||||||||||||||||||||||||||||||||
| 1 | The growth rates for C2 are in the table presented as they were at the time of the C3 release. |
RevisionsThe statistics for external loan debt are based on samples, and therefore associated with more uncertainty than the statistics for domestic debt (C2). Foreign debt data are subject to continuous revision. Any major impacts of the revision are presented here. In connection with the publication of K3 data on 9 March, a comprehensive revision of the foreign debt’s basis of figures was undertaken. The revision relates to the period December 2007-December 2012. The changes apply primarily to internal group debt. The revision has helped temper the volatility of the foreign debt’s growth (see the box below). For more details concerning sampling, see section 3.3 in About the statistics . |
DefinitionsThe public comprises households, non-financial enterprises and municipalities. Mainland Norway consists of all domestic production activity except for exploration of crude oil and natural gas, services activities incidental to oil and gas, transport via pipelines and ocean transport. |
|
C3 is an approximate measure of the size of the total gross debt of the public in NOK and foreign exchange. C3 comprises the sum of C2 (the public’s domestic gross debt) and the public’s external loan debt, of which C2 constitutes the largest part. The C3 statistics are published approximately one month later than C2. It should be noted that the growth rates for the public’s gross external loan debt vary from month to month due to shifting amounts of short-time internal debt by oil companies. In addition, the first-time-published growth rates are often revised at a later date due to improved information. |
The statistics is now published as Credit indicator.
Contact
-
Statistics Norway's Information Centre
E-mail: informasjon@ssb.no
tel.: (+47) 21 09 46 42