Content
Published:
This is an archived release.
Declining, but continued high debt growth
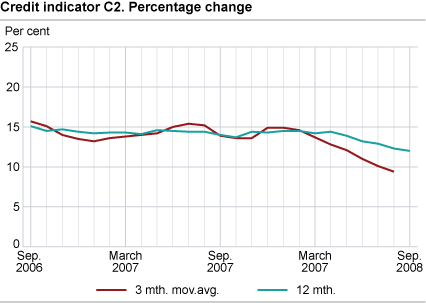
The twelve-month growth in the credit indicator C2 was 12.0 per cent to end-September, down from 12.3 per cent to end-August. Debt growth decreased for municipalities, households and non-financial enterprises.
Non-financial enterprise gross domestic debt amounted to NOK 1 153 billion at end-September. The twelve-month growth to end-September was 18.8 per cent, down from 18.9 per cent to the previous month. Since December 2007, the non-financial enterprises have been the main contributor to the twelve-month growth in the credit indicator C2, even though the households still represent a larger part of the general public gross domestic debt.
Converted to annual growth rate, the non-financial gross debt for the period July-September increased by 13.8 per cent compared with the three previous months. One month earlier this growth rate was 14.6 per cent. The fact that the growth based on the three-month moving average is lower than the twelve-month growth indicates that the twelve-month growth will continue to fall.
The growth in non-financial enterprise money supply has fallen substantially in recent months; see the money supply M2 statistics.
Household debt growth continues to fall
Household gross domestic debt totalled NOK 1 843 billion at end-September. The twelve-month growth continued to fall this month to 8.7 per cent, compared with 9.1 per cent to end-August. This was the lowest twelve-month growth since January 2000.
Contributing factors to the high growth rates
The changed economic prospects have contributed to a dampening of the demand for new loans during the last few months. In addition, the financial crisis has led to a sharpening of the financial corporation credit practice. In the long term, this will contribute to a reduction in the debt growth rates. In the evaluation of the growth rates in relation to C2, however, it should be noted that when an investment decision has been taken and a possible loan commitment is given there will always be a certain delay before this is included in actual debt data. In a situation with tight liquidity, neither is it unlikely that customers to a greater extent than before draw on their credit lines, which also contributes to high debt figures.
The continued relatively strong growth in household gross domestic debt may, in addition, be related to the tendency that households to a greater extent than before have the possibility to defer repayments on their loans in financial enterprises. Thus, the lending growth will continue to be high, even though the growth for new loans decreases.
Growth rates affected by portfolio shifts
The general public gross domestic debt C2 amounted to NOK 3 208 billion at end-September, of which 67 per cent consists of bank loans. The twelve-month growth in bank loans decreased from 9.4 per cent to end-August to 5.6 per cent to end-September, and the twelve-month growth in credit from mortgage companies rose from 43.8 per cent to 65.2 per cent in the same period. The growth rates are affected by transfers of loans from banks to mortgage companies. This is due to the new legislation on covered bonds.
| April 2008 | May 2008 | June 2008 | July 2008 | August 2008 | September 2008 | ||||||||||||||||||||||||||||||||||
|---|---|---|---|---|---|---|---|---|---|---|---|---|---|---|---|---|---|---|---|---|---|---|---|---|---|---|---|---|---|---|---|---|---|---|---|---|---|---|---|
| 12 mth. total | 14.4 | 13.9 | 13.2 | 12.9 | 12.3 | 12.0 | |||||||||||||||||||||||||||||||||
| 3 mth. moving average tot | 12.8 | 12.1 | 11.0 | 10.1 | 9.4 | ||||||||||||||||||||||||||||||||||
| 12 mth. households | 10.9 | 10.3 | 9.9 | 9.4 | 9.1 | 8.7 | |||||||||||||||||||||||||||||||||
| 12 mth. non-financial enterprises | 22.1 | 21.3 | 20.3 | 20.3 | 18.9 | 18.8 | |||||||||||||||||||||||||||||||||
|
C2 is an approximate measure of the size of the gross domestic debt of the general public (households, non-financial enterprises and municipalities) in NOK and foreign currency. Statistics Norway also compiles the credit indicator C3, which in addition to C2 (the public’s domestic gross debt) also includes the public’s external loan debt. Most of the public’s external loan debt refers to non-financial enterprises. The C3 statistics are published approximately one month later than the C2. |
The statistics is now published as Credit indicator.
Contact
-
Statistics Norway's Information Centre
E-mail: informasjon@ssb.no
tel.: (+47) 21 09 46 42

