Content
Published:
This is an archived release.
Increased employment among people with health care education
The number of employed with health care education increased by 2 per cent from 2002 to 2003. The number of foreign citizens who have worked in Norway for less than five years, decreased by 10.5 per cent.
In total, there were 300 959 people with health care education in Norway as of 1 of October 2003, an increase of 2.2 per cent from the previous year. The share of employed with health care education decreased slightly, by 0.1 per cent to 86.5 per cent.
The number of foreign personnel working in health care services and who have worked in Norway for less than five years, fell by 10.5 per cent. There number of employees from the Nordic countries fell, but there was an increase in personnel from the rest of Europe and Asia.
More personnel with health care education in health care services
Of the increase of 5 400 employed people with health care education, 83 per cent of the growth was in health care services. The share of people with health care education working in health care services remains unchanged at 77 per cent. In health care services, there was an increase in the employment rate of 2.3 per cent among people with health care education.
Half work in municipal services
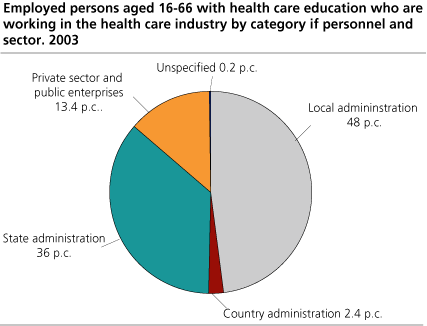
95 160 people, 48 per cent of the employed in health care health care services worked in municipal services. This is more or less stable compared with the previuos year - the increase was 1.2 per cent. The increase in health care services mainly came in the private sector, where there was an increase in employment of 3.9 per cent.
Fewer without health care education
The number of employed without health care education had a lower increase (1 per cent) than the total growth of 2 per cent in the health care services. 42 per cent of the people employed in this field have no health care education, but this share is 2 per cent lower than in 2001.
A large share of employed people without health care education, had administrative work or worked in support functions such as cleaning, food services and maintenance. Statistics Norway does not have sufficient information about the share of people working directly with patients, thus unskilled workers in their jobs in the health care services. The reason for this is quality problems in the information about professions delivered from the counties, municipalities and the health enterprises.
Decrease in the number of employees from temping agencies
832 people with health care education were employed in Norwegian temping agencies. This is a decrease of 18 per cent from the previous year. The development of a steady growth in the number of employees from temping agencies therefore seems to be reversed.
Increased share of female doctors
The share of male physicians fell by 3 per cent from 2002 to 2003. The same developement was recorded in other educational groups with a large share of men, for example opticians and psychologists. The share of men among paramedics, specialized physicians and specialized dentists remains unchanged. For health care educations as a whole, women made up 85 per cent of the employed.
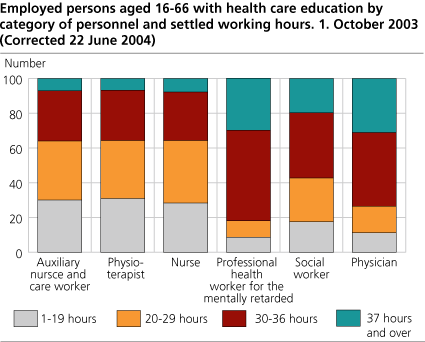
6 of 10 with health care education on a secondary level is working part-time
If we look at the main job for the employed in health care services, the weekly average agreed working hours were 29.5 hours. The use of part time work is most widespread among employees with education on a secondary level, for example auxiliary nurses, care workers and child care workers. 67 per cent of dentists and physicians had average working hours of 37 hours or more.
20 600 man-labour years lost in sickness
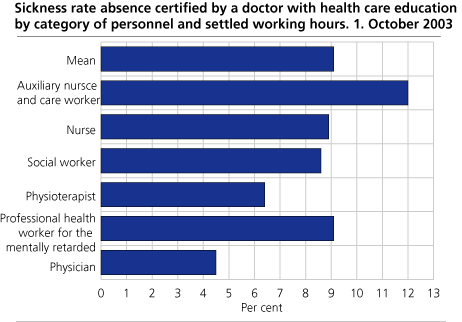
Of a total of settled man years among personnel with health care education, 20 600 man years (6.8 per cent) were lost in doctor-certified sickness absence, while 4 300 man years were lost in maternity leave. The doctor-certified sickness absence constitutes about 90 per cent of total sickness absence.
Educational groups with a high rate of sickness absence were care workers, child welfare officers, professional health workers and child care workers. Dentists, physicians and physioterapists, on the other hand, had a low sickness absence compared with the average of all health care educations.
Tables
Table 1-2: Number of persons with health care education, by category of personnel and employment status. 1 October 2003
Table 3-5: Employed persons with health care education aged 16-66 by category of personnel, settled working hours and settled man-years. 1 October 2003
- Table 3 Settled working hours for all employees
- Table 4 Settled working hours for employees in the health care industry
- Table 5 Settled man-years for all employees
Table 6-10: Employed persons aged 16-66 with health care education, by category of personnel, industry and sector. 1 October 2003
- Table 6 All industries. Per cent
- Table 7 All industries. Per cent change
- Table 8 Health care industry by sector. 2002
- Table 9 Health care industry by KOSTRA-functions
- Table 10 Non-health care industries, public administration, research and education
Table 11: Employed persons and settled man-years aged 16-66 in the health care industry, by category level. Per cent change. 1 October 2002 and 2003
Table 12: Employed persons aged 16-66 with foreign citizenship with health care education in the health care industry that has been working in Norway less than 5 years, by category of personnel. Per cent change. 1 October 2003
Table 13: Employed specialized nurses, physicians and dentists aged 16-66, by speciality and industry. Per cent and per cent change. 1 October 2002 and 2003
Contact
-
Arbeidsmarked og lønn
E-mail: arbeidsmarked@ssb.no
-
Fredrik Steinrem Edelmann
E-mail: fredrik.edelmann@ssb.no
tel.: (+47) 40 90 24 60
-
Sophie Sæternes
E-mail: sophie.saeternes@ssb.no
tel.: (+47) 98 67 14 26
-
Stine Bakke
E-mail: stine.bakke@ssb.no
tel.: (+47) 91 52 62 51


