Content
Published:
This is an archived release.
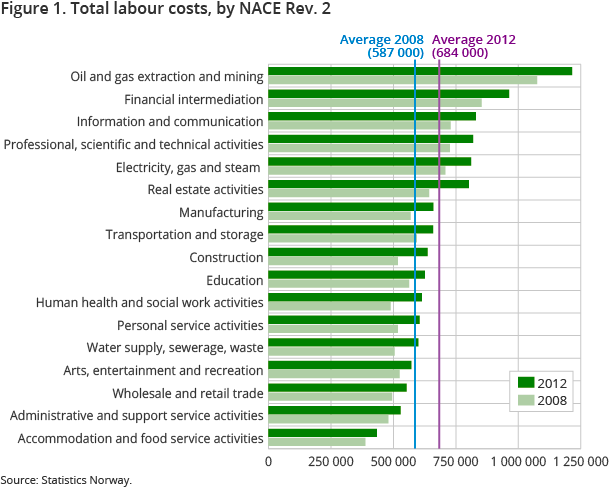
Oil FTE cost NOK 1.2 million
The average labour cost amounted to NOK 1.2 million per full-time equivalent (FTE) in oil and gas extraction and mining. This corresponded to a 13.1 per cent increase from 2008. The average amount for all industries in total was NOK 684 000.
| 2012 | |
|---|---|
| Total labour costs (NOK) | 683 900 |
| Direct costs (NOK) | 537 400 |
| Indirect costs (NOK) | 146 500 |
| Salaries in kind (NOK) | 18 900 |
| Employers' social contributions (NOK) | 55 800 |
| Training costs (NOK) | 9 200 |
| Taxes deducted subsidies (NOK) | 73 600 |
| Other labour costs (NOK) | 2 500 |


Labour costs include both direct and indirect costs of employees. Direct costs are wages and salaries in cash. Indirect costs include employers` social security contributions, pension plans and insurance, payments in kind and training costs, as well as other miscellaneous costs.
Direct costs increased by 17.1 per cent
From 2008 to 2012, the direct costs in total for all industries increased by 17.1 per cent, which corresponded to an average annual increase of 4 per cent, with some variations between NACE sectors. The highest percentage increase was observed in human health and social work activities, real estate activities and construction. The administrative and support service activities, education and arts, entertainment and recreation industries had the lowest percentage growth from 2008.
Indirect costs amounted to 21.4 per cent of the total cost
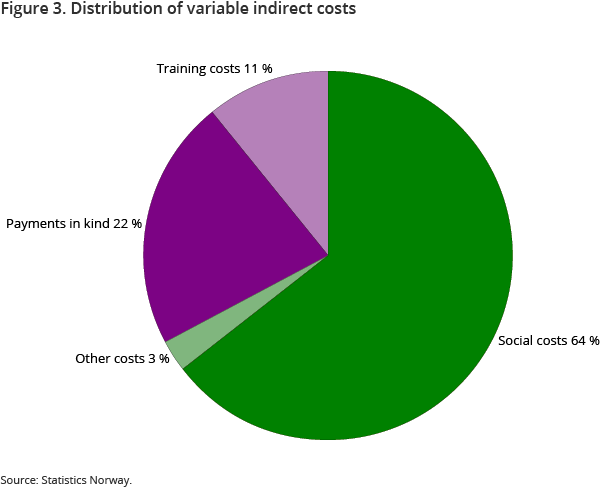
On average, the indirect costs amounted to 21.4 per cent of the total labour costs, where employers' national insurance contributions and pension plans and insurance were the largest components.
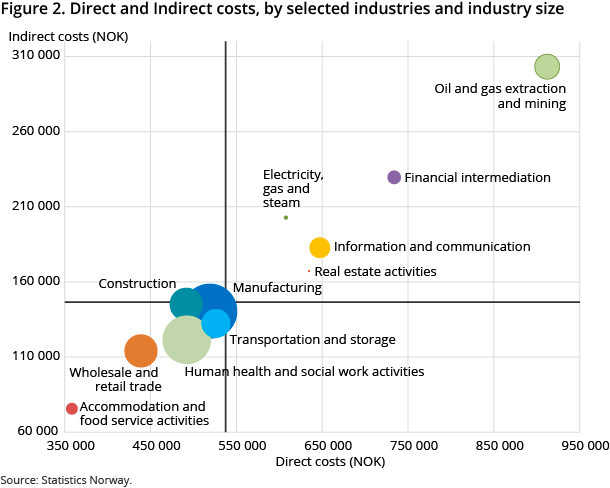
Industries with a high level of direct costs tend to have a high level of indirect costs, i.e. there is a strong correlation between the levels of variables within industries.
13.7 per cent of paid hours were in fact not worked
Hours actually worked were, on average, 86.3 per cent of the paid hours per employee. The costs for the days not worked amounted to 15.6 per cent of direct costs.
The main difference between paid hours and hours actually worked consists of holidays, official public holidays, sick leave and other days not worked.
Contact
-
Thomas Hagen
E-mail: thomas.hagen@ssb.no
tel.: (+47) 40 81 13 20
-
Heidi Bekkevold Backe
E-mail: heidi.backe@ssb.no
tel.: (+47) 40 81 13 22
-
Marianne Mellem
E-mail: mnm@ssb.no
tel.: (+47) 40 81 14 42
