Content
Published:
This is an archived release.
Tail wind for the tram
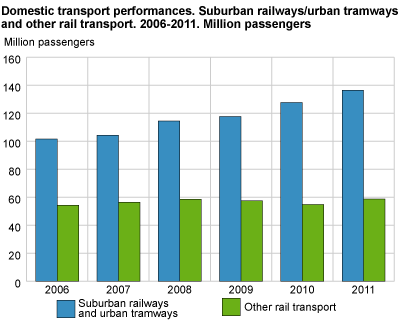
Almost 137 million passengers travelled by suburban railways and urban tramways in 2011. This was an increase of about 12 million passengers from 2010.
There were minor changes in the number of passengers travelling by suburban railways and urban tramways from the mid 1990s and the following 10 years. In the period 2006-2011, the number of passengers using these means of transport increased by 35 million, or 34 per cent. As a comparison, the number of passengers travelling by train increased by 4.5 million in the same five-year period. This was an increase of 8 per cent.
Increase for air transport also
Except for suburban railways and urban tramways, air transport had the strongest increase in traffic of the other scheduled means of transport in 2011. The number of passengers and passenger kilometres both increased by 5 per cent from 2010. Measured by number of journeys, air transport is, however, rather modest, with 11 million passenger travellers in 2011. This constituted about one fifth of the passengers transported by taxi in 2011. Measured in passenger kilometres however, the transport work performed by air corresponded to nine taxi trades in 2011, or 4.8 billion passenger kilometres.
Almost 2 per cent increase in traffic by private cars
The transport performances increased by 1.5 billion passenger kilometres in total in 2011, to 75.4 billion. The private cars constituted 64 per cent of the increase and 77 per cent of the total transport performances in 2011. The transport work performed by private cars increased by 1 billion passenger kilometres in 2011; the same as the increase in 2009 and 2010 together.
A minor reduction in the transport by sea and by road.
After several years characterised by growth for both maritime transport and goods lorry transport, the statistics for 2009 show a decrease for both modes of transport. The financial crisis hit the goods lorry transport industry quite quickly and hardest in 2009. The transport performances fell by 8 per cent that year. The corresponding decrease for the transport of goods by sea was more modest by 3 per cent in 2009. The statistics for 2010 show that the goods road transport industry recovered faster from the tight economic frames compared to the maritime transport industry. While the increase for the road goods transport came to almost 7 per cent in 2010, the goods transport by sea experienced a further decrease of nine per cent the same year. The negative trend strongly decelerates in 2011. The maritime transport performances this year constituted 14.3 billion tonnes-kilometres; a decrease of only 0.3 per cent. The road goods transport also experienced a minor decrease of 1.2 per cent in 2011 to almost 17 billion tonnes-kilometres.
.but the railway transport of goods increased
The transport work performed by rail constituted 2.4 billion tonnes-kilometres in 2011; an increase of 3 per cent. Measured in tonnes transported, the increase was 12 per cent from 2010 to 2011. This can be explained by the reduction in the average length of transport by 8 per cent to 300 kilometres in 2011. This must be viewed against the changes in the balance of transport between the main operator and the new operators in this market/field.
Tables:
Contact
-
Geir Martin Pilskog
E-mail: geir.martin.pilskog@ssb.no
tel.: (+47) 40 81 13 83

