Content
Published:
This is an archived release.
Almost unaltered public transport
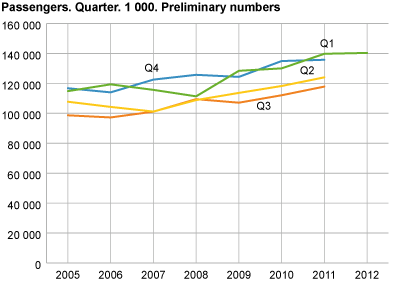
There were only marginal changes in public transport in the first quarter of 2012 compared to the same period in 2011. This is a continuation of last quarter’s tendency.
The flattening in the use and production of public transport, first registered in the fourth quarter of 2011, continued in the first quarter of 2011. Production had an overall growth of almost 1 per cent, while passengers and ticket revenues were nearly unaltered.
Increased production for buses, reduced use
Despite an increase in vehicle kms for buses of 1.3 per cent, both the number of passengers and ticket revenues were reduced, by 0.8 and 0.5 per cent respectively from the first quarter of 2011 to the first quarter of 2012. Comparing the same quarters, the opposite was the case for the train segment. The number of train kms was reduced by 2.7 per cent, while passenger numbers increased by 2.1 per cent and ticket revenues increased by 1.3 per cent.
Increased utilisation of boats
Passenger boats went 6.2 per cent further and carried 10.4 per cent more passengers in the first quarter of 2012 compared to the same period in 2011. Meanwhile, ticket revenues decreased by 4.1 per cent. However, the winter season is the low season and is strongly influenced by wind and other weather.
|
Vehicle-/boat-/train kms.
1 000 |
Passengers. 1 000 | Ticket revenues. 1 000 NOK | |||||||||||||||||||||||||||||||||||||||||||||||||||||||||||||||||||||||||||||
|---|---|---|---|---|---|---|---|---|---|---|---|---|---|---|---|---|---|---|---|---|---|---|---|---|---|---|---|---|---|---|---|---|---|---|---|---|---|---|---|---|---|---|---|---|---|---|---|---|---|---|---|---|---|---|---|---|---|---|---|---|---|---|---|---|---|---|---|---|---|---|---|---|---|---|---|---|---|---|---|
| 2006 | 383 956 | 434 850 | 7 668 619 | ||||||||||||||||||||||||||||||||||||||||||||||||||||||||||||||||||||||||||||
| 2007 | 394 684 | 440 142 | 8 526 212 | ||||||||||||||||||||||||||||||||||||||||||||||||||||||||||||||||||||||||||||
| 2008 | 395 034 | 444 994 | 9 041 245 | ||||||||||||||||||||||||||||||||||||||||||||||||||||||||||||||||||||||||||||
| 2009 | 400 278 | 473 459 | 9 307 570 | ||||||||||||||||||||||||||||||||||||||||||||||||||||||||||||||||||||||||||||
| 2010 | 398 126 | 495 444 | 9 476 698 | ||||||||||||||||||||||||||||||||||||||||||||||||||||||||||||||||||||||||||||
| 2011 | 405 810 | 517 410 | 9 852 435 | ||||||||||||||||||||||||||||||||||||||||||||||||||||||||||||||||||||||||||||
| Q1 | 105 848 | 139 764 | 2 472 651 | ||||||||||||||||||||||||||||||||||||||||||||||||||||||||||||||||||||||||||||
| Q2 | 100 314 | 124 025 | 2 507 231 | ||||||||||||||||||||||||||||||||||||||||||||||||||||||||||||||||||||||||||||
| Q3 | 95 591 | 117 859 | 2 413 306 | ||||||||||||||||||||||||||||||||||||||||||||||||||||||||||||||||||||||||||||
| Q4 | 104 057 | 135 762 | 2 459 247 | ||||||||||||||||||||||||||||||||||||||||||||||||||||||||||||||||||||||||||||
| 2012 | |||||||||||||||||||||||||||||||||||||||||||||||||||||||||||||||||||||||||||||||
| Q1 | 106 766 | 140 350 | 2 477 413 | ||||||||||||||||||||||||||||||||||||||||||||||||||||||||||||||||||||||||||||
Preliminary figuresThe figures are preliminary and may be adjusted for comparisons to the new annual survey for 2012. |
Tables:
- Table 1 Vehicle kms, passengers and ticket revenues. Bus. 2006-2010, Q1-Q4 2011 and Q1 2012. Preliminary figures
- Table 2 Boat kms, passengers and ticket revenues. Boat. 2006-2010, Q1-Q4 2011 and Q1 2012. Preliminary figures
- Table 3 Train kms, passengers and ticket revenues. Rail. 2006-2010, Q1-Q4 2011 and Q1 2012. Preliminary figures
Contact
-
Jardar Andersen
E-mail: jardar.andersen@ssb.no
tel.: (+47) 99 70 08 04

