Emissions to air of NOx from domestic navigation and fishing

New NOx factors give reduced emissions from ships

Published:

Domestic navigation and fishing contributes to about one third of the total emissions of nitrogen oxides (NO x ) to air in Norway. New emission factors have resulted in the estimated emission figures being six to ten per cent lower than earlier estimates for the period 1990-2008. A new report describes how the emissions are estimated in the national emission inventory and how the emission factors are calculated.

Based on new information, the figures for emissions to air of NO x from Norwegian domestic navigation and fishing boats are updated and improved in the emission inventory. The project report documents how emissions to air from Norwegian domestic navigation and fishing are estimated, and how new updated emission factors for marine gas oil, heavy distillate and heavy fuel oil have been developed.

NO x emissions from the national emission inventory

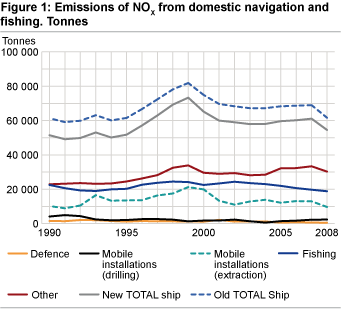
Figure 1 shows the yearly emissions from the different sources in the emission inventory estimated with new factors. The revised factors have given a reduction in the emissions of six to ten per cent in the period 1990-2008.

The trend in the period 1996-2002, and the peak in 1999, are among other factors caused by the trend in the consumption as it is registered in the energy account. There was a high level of oil and gas extraction activity around the year 2000, which among other things led to high activity for shuttle tankers and offshore vessels.

There has been, particularly in recent years, uncertainty associated with the distribution of marine gas oil between domestic and international sea traffic, due to inadequate reporting of sales statistics by oil companies. This has resulted in uncertainty in the trend in the emission estimates for recent years.

Energy consumption and mean emission factors

In the yearly emission estimates that are published by Statistics Norway in collaboration with the Climate and Pollution Agency, emissions of NO x are estimated based on energy consumption figures and mean emission factors for the different sources in the emission inventory. Energy consumption for domestic navigation is taken from Statistics Norway’s energy account. With regard to fishing, figures from the sales statistics for petroleum products are being used.

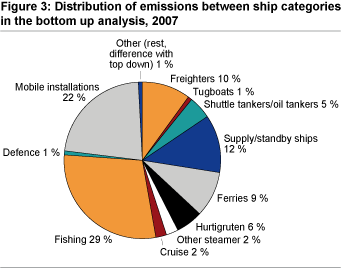
Emissions from domestic navigation and fishing are divided into a small number of categories in the Norwegian emission inventory; fishing, extraction and drilling of oil and gas (mobile installations), defence and the category ”other”, which among other things includes the industry domestic water transport. The estimated energy consumption based on statistics for mean fuel consumption for defined ship categories (bottom up calculations) will deviate from the energy consumption as it appears in the energy account and the sales statistics. The mean emission factor that is used for the industries in the “other” category is also used for the difference (rest) between the bottom up calculated consumption and the consumption figures in the energy account.


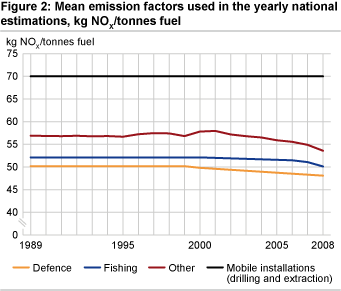
The updated mean emission factors show a clear decline after the year 2000 (Figure 2). The development in the mean emission factors is dependent on several factors. One such factor is changes in the fleet composition, which can be one of the explanations for the decline in the mean emission factors in recent years. For example, the share of the consumption that goes to shuttle tankers with a relatively high emission factor has been reduced. Another explanation is the gradual phasing in of new engines with lower emissions after the year 2000. Measures such as catalytic purification have helped reduce the emission factor from the year 2007. The emission factor for mobile installations has remained constant for the whole period.


Figure 1. Emissions of NOx from domestic navigation and fishing. Tonnes

Figure 2. Mean emission factors used in the yearly national estimations, kg NOx/ tonnes fuel.

Figure 3. Distribution of emissions between ship categories in the bottom up analysis, 2007.

Detailed emission figures per ship category for the year 2007

For the years 1993, 1998, 2004 and 2007, detailed bottom up calculations of the consumptions have been carried out. Good consumption data are available for these years, and this has made it possible to estimate emissions on a more detailed level. Table 1 and Figure 3 show emission figures at a detailed level for the year 2007.

Update of emission factors

A goal for the project has been to update the mean emission factors used in the emission estimates, and new emission factors for NO x from Marintek have been implemented in the national emission inventory for ships. The new base emission factors from Marintek apply to emissions of NO x for different engine types (slow, medium and high speed), built before and after new IMO emission requirements were introduced in 2000. The base factors are weighted in two steps; first according to the distribution of engine types within the different categories of ships (freighters, tugboats, ferries etc.). Subsequently, they are weighted according to consumption for the different categories of ships. This calculation is performed for the years 1993, 1998, 2004 (partly) and 2007. Good consumption data are available for these years for all ship categories. Based on estimated emissions and fuel consumption from the bottom up calculations, mean emission factors for NO x are produced for the actual industries, and used for emission estimations for domestic navigation and fishing. For the intervening years, mean emission factors are estimated by interpolation. The same factors are used for the fuel types marine gas oil, heavy distillate and heavy fuel oil.


With regard to the project work, Statistics Norway has been using new data from the Directorate of Fisheries by the weighting of emission factors. Ferjefaktautvalget (Committee on ferry facts) has also contributed with consumption and emission figures for ferries, which have been used in the calculations. The Business Sector’s NO x fund has also given access to a database with consumption and emission data for 2007 and figures for emission reductions owing to measures. Distribution of ship categories and consumption figures used in the calculations are mainly given by data from the NO x fund, except for the industries defence, fishing and oil and gas production (mobile installations).

The NO x fund and reduction measures

A NO x tax was introduced on 1 January 2007. When approval was given for introduction of the tax it was decided that business organisations that enter into an environmental agreement with the Government on NO x -reducing measures would be exempt from the tax. In January 2008, 14 central business organisations entered into such an agreement with the Ministry of Environment. The agreement covers the period 2008-2010, and entails a commitment to reduce the NO x emissions by 30 000 tonnes. Business organisations that join the agreement must make payments to the Business Sector’s NO x fund, which provides financial support for cost-effective NO x -reducing measures. Negotiations on extending the agreement are ongoing, and are expected to be finalised before the end of 2010. Actual measures can be the installation of pollution-abatement equipment, improvement of combustion processes or transition to energy goods that give lower emissions. The emission reductions are expected to mainly take place in 2010 and will be fully completed during 2011. If less than 90 per cent of the emission commitment is fulfilled by expiry of the term, a charge has to be paid for the part of the emission reduction that has not been fulfilled.


In the base NO x factors from Marintek, effects of measures are not included. Measures can influence both the size of the factor and the size of the consumption. Some measures can increase the fuel consumption to some extent. If measures reduce the NO x emissions because of a more effective engine, i.e. whereby the fuel consumption is also reduced, this effect should not be included in the factor stipulation. Gas drive as a measure is intercepted by changes in fuel consumption and by the estimation of emissions from gas consumption.

Table 1: Emissions of NO X from the ship categories in the bottom up analysis, 2007. Tonnes
 
Ship categories Emissions (tonnes NO X )
 
Freighters 6 915.146
Tugboats  721.728
Shuttle tankers/oil tankers 3 261.008
Supply/standby ships 8 191.934
Ferries 6 424.500
Hurtigruten 3 891.000
Other steamer 1 693.203
Cruise 1 622.639
Fishing 19 848.763
Defence  632.776
Mobile installations 15 240.900
Other (rest, difference with top down)  533.570
Total 68 977.168
 

The total fuel consumption estimates in the top down and bottom up calculations show a difference of 1 per cent for 2007. This can be explained by the fact that the bottom up method does not cover all ships. Another explanation can be that the allocation between domestic and international sea traffic is not exact enough in the sales statistics for petroleum products.


Definition of domestic navigation and fishing

In the emission inventory, “domestic navigation” is used for all sea transport (except fishing boats) between two Norwegian ports, regardless of where the ships have bunkered. “Ports” includes installations on the Norwegian part of the continental shelf. It is important to distinguish between this and the definition of the industry domestic water transport as it is used both in the national account and the energy account published by Statistics Norway. The industry domestic water transport consists of sea, coastal and inland transport of freight and passengers, and only a part of the source domestic navigation as it is defined in the emission inventory.


According to international guidelines, emissions from fishing shall be estimated based on the amount of fuel sold in the country.


Emissions from international sea traffic (international marine bunkers) are not included in the national emission figures and are reported separately, according to international guidelines.


Contact