Content
Published:
Record warm weather resulted in lower energy consumption in 2014
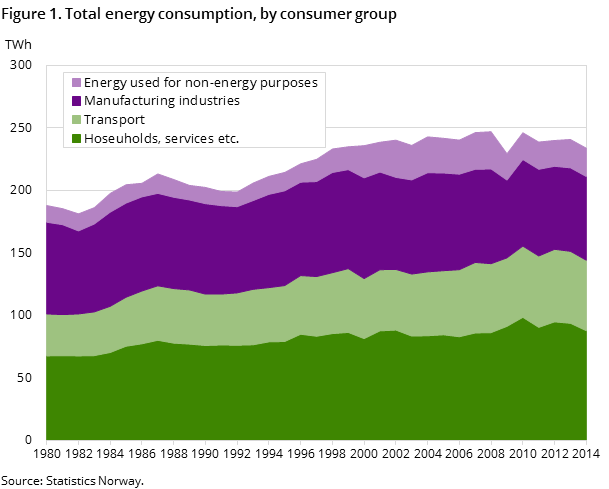
In 2014, the total domestic energy consumption, excluding the energy industries and consumption of raw materials, was 211 TWh. This is 3 per cent lower than the year before and the lowest since the fall in activity and energy consumption in 2009 due to the financial crisis.
| All energy products | Change in per cent | ||
|---|---|---|---|
| 2013 | 2014 | 2013 - 2014 | |
| Primary energy production | 2 264 | 2 289 | 1.1 |
| Imports | 96 | 76 | -21.5 |
| Exports | 1 992 | 2 039 | 2.4 |
| International bunkers (marine and aviation) | 11 | 10 | -6.6 |
| Changes in stocks (+ = net decrease,- = net increase) | -4 | 12 | -434.3 |
| Total energy supply | 354 | 327 | -7.6 |
| Energy industries own use and energy converted | 65 | 69 | 6.2 |
| Losses and statistical differences | 57 | 37 | -34.2 |
| Final consumtion including non-energy use | 241 | 234 | -2.9 |
| Non energy use | 23 | 23 | -0.1 |
| Final consumtion excluding non-energy use | 218 | 211 | -3.2 |
| Manufacturing, mining and quarrying | 67 | 67 | 0.4 |
| Transport | 58 | 56 | -2.2 |
| Other sectors | 94 | 88 | -6.3 |
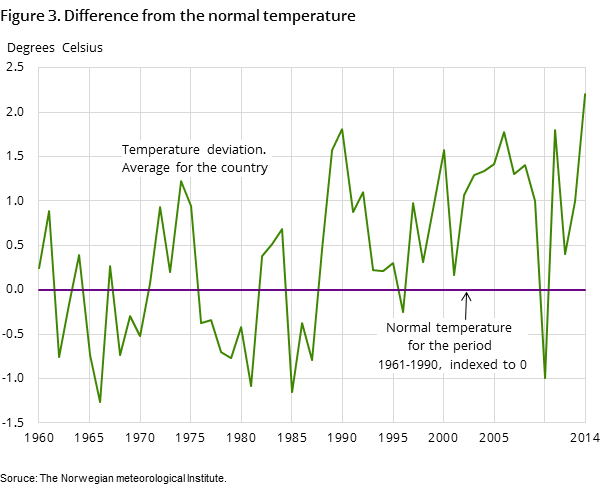
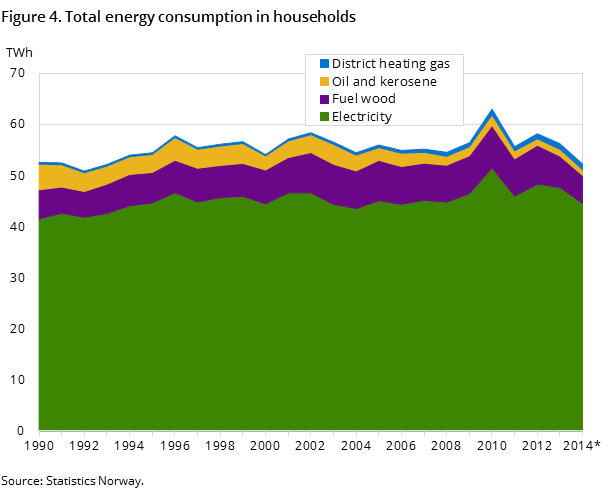
In 2014 there was a decrease in energy consumption both for heating purposes in households and services and for transport purposes. The decrease in energy consumption for heating has a clear correlation with historically high temperatures in 2014. According to the Norwegian Meteorological Institute, 2014 was the warmest year in a time series that goes back to 1900, with a temperature 2.2 degrees above what is considered the normal temperature.
Drop in energy consumption for households and services
Net domestic energy consumption, excluding consumption in energy industries and as raw materials, is divided into three main groups; industry, transport purposes and "other sectors". These made up 32, 27 and 41 per cent respectively of consumption in 2014.
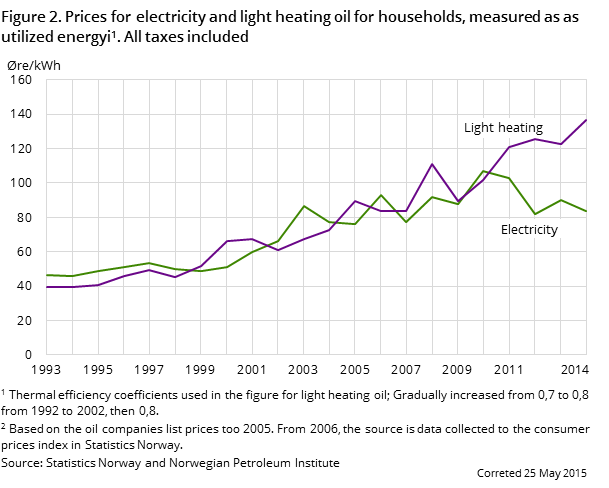
Energy consumption in the group "other sectors ", where households and services account for around 87 per cent of energy consumption, was 6 per cent lower in 2014 than the year before. A large share of the energy consumption here is used for heating. The consumption of electricity in this consumer group decreased by around 5 per cent, while heating products such as fuel wood and kerosene and heating oil fell by 10 and 14 per cent respectively. Lower electricity prices and higher prices of heating oil made it less expensive to use heat pumps or electric heaters instead of petroleum products.
Lower gasoline consumption, but more cars using diesel and electricity
In 2014, the energy consumption for transport purposes made up around 56 TWh, which was around 2 per cent lower than the year before. Gasoline consumption has fallen in recent years, and in 2014 dropped a further 5 per cent from the year before. The decline is due to a higher share of diesel cars and fewer gasoline cars. Consumption of diesel has risen steadily in recent years and in 2014 was about 1 per cent above the level in 2013. There has also been a sharp increase in the number of electric vehicles. From 2013 to 2014, the number more than doubled, from about 18 000 to 39 000, and now accounts for around 1.5 per cent of the passenger car fleet. The estimated power consumption for these is around 55 GWh, when assuming they use about 0.2 kWh per km and have an annual mileage of around 7 000 km. The average driving distance is uncertain, but it is likely that they run less than other vehicles due to the relatively short driving distance per charge. Hybrid cars are not included in these figures.
There is also some consumption of natural gas in land transport, mainly LNG, but also compressed natural gas (CNG). This consumption rose by around 10 per cent from the previous year.
The transition from oil to natural gas in shipping and fishing
In 2014, there was a large decrease in the use of both marine gas oil and heavy fuel oil, which is mainly used for domestic and international shipping, fishing boats and the supply business offshore. Natural gas consumption for domestic shipping rose however by 18 per cent from the year before, and this may indicate that there has been a certain shift from oil to gas in transport. Nevertheless, gas represents just 10-15 per cent of total energy consumption to domestic shipping. The natural gas used in transport was liquefied LNG.
Slight increase in energy use for industry
Preliminary figures for 2014 show a slight increase in energy use for manufacturing industries of 0.4 per cent from the previous year, but the development varied for different industries. Energy used in the manufacture of paper and paper products dropped by around 8 per cent in 2014. In other electricity intensive industries there was a slight increase in energy consumption from the previous year, particularly for the production of industrial chemicals, with an increase of 4 per cent.
Increased energy consumption for oil and gas extraction
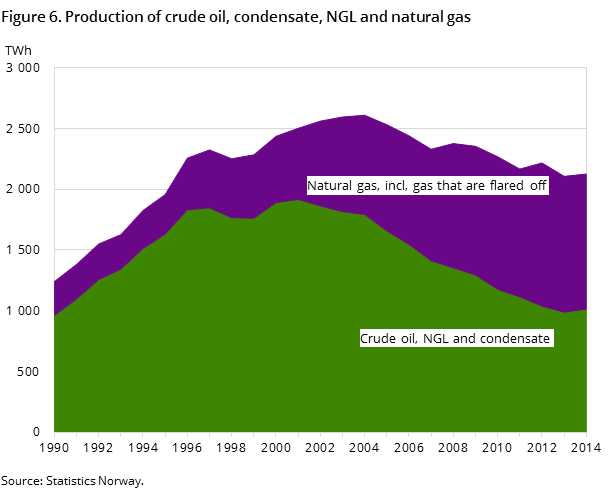
Energy consumption in energy industries and energy as a raw material in industry is not included in the figure for “net domestic consumption of energy”. If this is added, the energy consumption made up 296 TWh in 2014. The main part of the consumption in energy industries was in oil and gas extraction. From 2013 to 2014, this consumption rose by 6 per cent and came to about 54 TWh, which is almost as much as the energy used for domestic transport purposes. The increase reflects the fact that there was an increase in crude oil production of 3 per cent. Natural gas production declined slightly in 2014, but overall petroleum production still rose by about one per cent.
Energy used as raw materials in industry amounted to 23 TWh in 2014, which was at about the same level as the previous year.
Slight increase in Norway's share of renewables
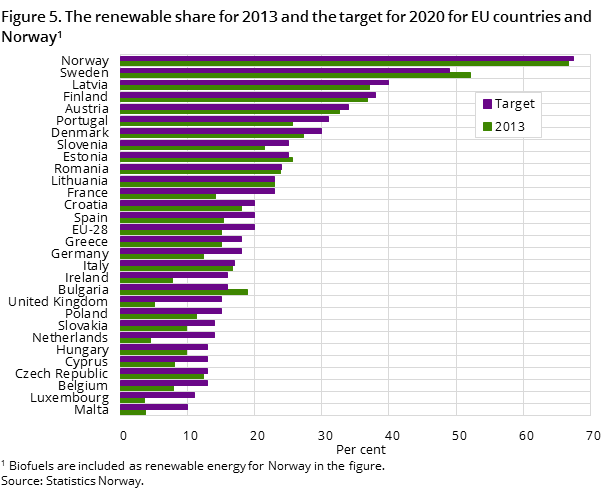
From 2012 to 2013, Norway’s renewable energy share rose from 66.5 to 66.8 per cent, while the share of renewable energy in transport was 4.5 per cent in 2013 when biofuels used in fuel were included. From 2011, there was a requirement that countries should have documentation to confirm that biofuels meet certain sustainability criteria. This documentation has not been available for Norway, but will be available during 2015. If biofuel is excluded as renewable energy, the share of renewables for transport is only 1.6 per cent, and the overall share of renewable energy is also slightly lower.
An important way of increasing the share of renewable energy is a joint electricity certificate market with Sweden.
The statistics is now published as Production and consumption of energy, energy balance and energy account.
Additional information
The statistics are published in spring and autumn. The spring publication is preliminary and aggregated to a larger degree, and only includes figures for energy balance. In the autumn publication, tables are also presented for the energy accounts.
Contact
-
Statistics Norway's Information Centre
E-mail: informasjon@ssb.no
tel.: (+47) 21 09 46 42
