Content
Published:
Higher consumption of gas and district heating
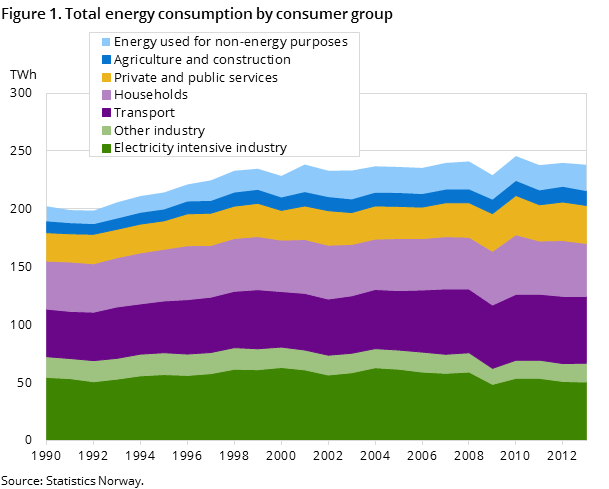
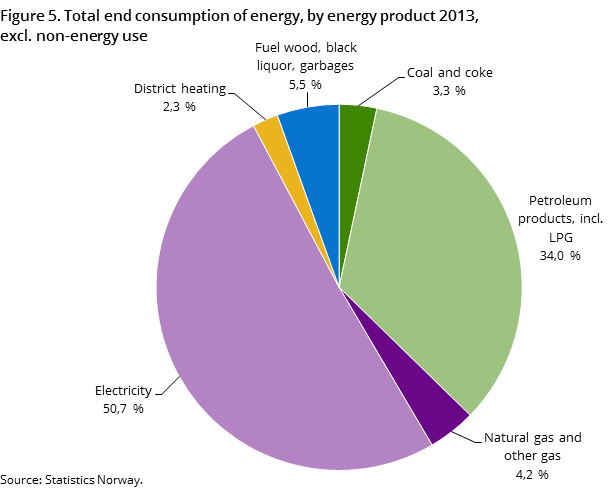
Energy use in 2013, excluding energy used as raw materials, was around 215 TWh, which represents a decrease of 1.7 per cent from the year before. Consumption of biofuels, oil products and electricity decreased from the previous year, according to preliminary figures, while the use of gas and district heating increased.
| All energy products | Change in per cent | ||
|---|---|---|---|
| 2012 | 2013 | 2012 - 2013 | |
| Primary energy production | 2 385 | 2 264 | -5.1 |
| Imports | 78 | 96 | 22.8 |
| Exports | 2 132 | 1 992 | -6.6 |
| International bunkers (marine and aviation) | 11 | 11 | 1.3 |
| Changes in stocks (+ = net decrease,- = net increase) | -3 | -4 | 5.2 |
| Total energy supply | 318 | 355 | 11.5 |
| Energy industries own use and energy converted | 60 | 65 | 8.0 |
| Losses and statistical differences | 19 | 61 | 220.1 |
| Final consumtion including non-energy use | 240 | 238 | -0.7 |
| Non energy use | 21 | 23 | 10.0 |
| Final consumtion excluding non-energy use | 219 | 215 | -1.7 |
| Manufacturing, mining and quarrying | 66 | 67 | 0.5 |
| Transport | 58 | 58 | -0.8 |
| Other sectors | 95 | 91 | -3.8 |
Energy used as raw materials rose by about 10 per cent from the year before, and if this consumption is included in the total energy consumption, the decline in total consumption from the previous year is 0.7 per cent.
Sharp decline for manufacture of paper and paper products
Manufacturing industries account for about 30 per cent of energy use domestically. Furthermore, the electricity intensive industry accounts for about three-quarters of this. In 2013, total industry consumption (excluding coal mining and refineries) increased by 0.5 per cent from the year before. It was especially the use of natural gas and other gases that increased. This rose by 6 and 11 per cent respectively. The development in energy consumption varied for different industries; energy consumption in the production of chemical raw materials and manufacturing other than electricity intensive industries increased, while energy consumption in manufacture of paper and paper products fell sharply, by more than 13 per cent from the year before. This was due to lower production as a result of many closures in this industry.
Less energy to coastal transport, more to other transport
Energy used for total transport purposes was reduced by about 1 per cent from the previous year. The decrease was mainly due to the energy used in coastal transport dropping by 8 per cent from the year before. In particular, the use of marine gas oils and heavy oils in coastal transport decreased, while consumption of natural gas increased by 18 per cent from the year before. This indicates that there has been some shift from oil to gas in coastal transport. Moreover, energy used in other transport, such as rail, air and road transport, increased from the previous year.
Less use of biodiesel, but more electric cars
About three-quarters of the energy use in transport is road transportation, and most of this consumption is based on fossil fuels. In Norway, the oil companies have to ensure that biofuels make up 3.5 per cent of their fuel sales to road transport. In addition, Norway has an aim, through the Renewables Directive , that the share of renewable energy to transport increases to 10 per cent in 2020. In 2013, however, the consumption of biodiesel decreased by 5 per cent from the year before, despite a 4 per cent increase in diesel consumption for road transport. This meant that the share of biodiesel in diesel fell slightly from the previous year, from around 5.1 to 4.7 per cent. This decrease was partially offset by the fact that more bioethanol was sold, despite a 7 per cent fall in gasoline consumption. Altogether, the share of biofuels in road transport was almost 4 per cent in 2013, compared with 4.1 per cent the year before.
In 2013, however, the electric car stock more than doubled, rising from around 8 000 electric cars in 2012 to nearly 18 000 by the end of 2013, which corresponds to approximately 0.7 per cent of the fleet. With a consumption of about 0.2 kWh/km and an average mileage of approximately 7 000 km per year, the estimated electricity consumption for these cars is about 25 GWh in a year.
Lower use of biofuels
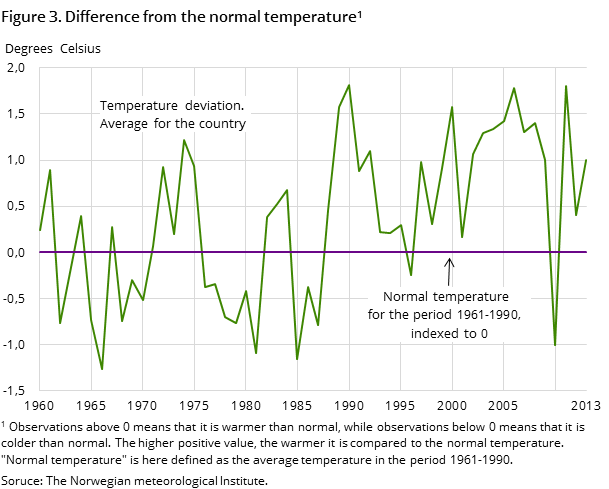
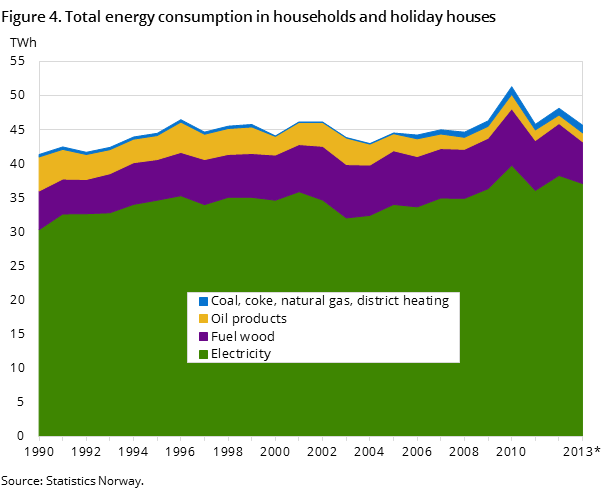
Consumption of biomass and biofuels went down about 13 per cent from 2012 to 2013. This is partly due to the closures in the paper and paper product industry, which is the largest consumer of biofuels among manufacturing industries. In manufacturing of paper and paper products, the consumption of biofuels dropped by 13 per cent from the year before. In addition, fuel wood consumption in households fell by 20 per cent from the previous year. This could be due to the somewhat warmer weather in 2013 than in 2012. The 3 per cent decline in the use of biofuels in transport from the year before also had a certain significance for the development of total biomass/biofuels.
Increased use of district heating
Preliminary figures show a decrease in energy use in households and services from 2012, particularly due to lower consumption of electricity and biomass. However, consumption of district heating in households and services rose by 14 and 9 per cent respectively from the year before. District heating in 2013 made up around 2 per cent of total energy use in households and 10 per cent of energy consumption in the service sector. District heating is an increasingly important energy product in Norway, and accounted for 2.3 per cent of the total energy consumption in 2013, compared to about 1 per cent just five years ago.
Lower energy production
In 2013, the total energy production decreased by 5 per cent from the year before, due to a decline in the production of natural gas, crude oil and electricity production. Production of electricity decreased by about 9 per cent from the year before, which must be viewed in conjunction with the record high electricity production level in 2012. However, Norway exported more power than it imported in 2013, and had an export surplus of around 5 TWh. In 2013, the production of coal rose by about 50 per cent from the year before. Coal is mainly produced for export, and amounts to barely one per cent of our total energy production.
Difference between energy account and energy balanceOpen and readClose
This publication comprises both energy balance and energy account tables. These are based on more or less the same figures, but are presented according to different principles and definitions, where the energy accounts follow the definitions in the national accounts and the energy balance comprises the energy consumption on Norwegian territory. These tables therefore give different figures for energy consumption. For more details, see About the statistics. This text presents results from the energy balance.
The statistics is now published as Production and consumption of energy, energy balance and energy account.
Additional information
The statistics are published in spring and autumn. The spring publication is preliminary and aggregated to a larger degree, and only includes figures for energy balance. In the autumn publication, tables are also presented for the energy accounts.
Contact
-
Statistics Norway's Information Centre
E-mail: informasjon@ssb.no
tel.: (+47) 21 09 46 42
