Content
Published:
This is an archived release.
Highest domestic migration ever
While net immigration to Norway in 2014 was lower than in the seven preceding years, many domestic migrations took place. Never before have so people many migrated within the same municipality. Added to the record high cross-municipality migration, this resulted in 788 000 migrations in 2014.
| 2014 | 2013 | |||
|---|---|---|---|---|
| Immigration | Emigration | Net immigration | Net immigration | |
| Total | 70 030 | 31 875 | 38 155 | 40 073 |
| Norway | 8 601 | 8 555 | 46 | -1 825 |
| Foreign | 61 429 | 23 320 | 38 109 | 41 898 |
| Selected citizenship | ||||
| Poland | 9 859 | 2 898 | 6 961 | 7 409 |
| Lithuania | 4 444 | 1 413 | 3 031 | 4 401 |
| Sweden | 4 626 | 3 840 | 786 | 1 056 |
| Latvia | 1 123 | 423 | 700 | 893 |
| Eritrea | 2 819 | 85 | 2 734 | 2 656 |
| Germany | 1 542 | 1 199 | 343 | 143 |
| Somalia | 1 653 | 200 | 1 453 | 2 575 |
| Afghanistan | 833 | 105 | 728 | 918 |
| Philippines | 2 157 | 1 144 | 1 013 | 1 736 |
| Iceland | 1 135 | 669 | 466 | 389 |
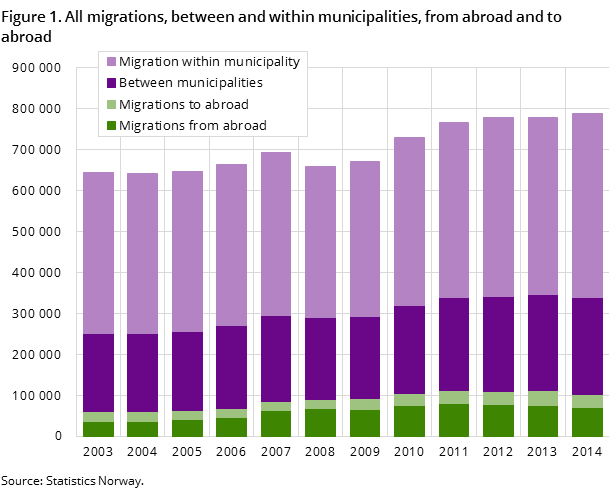
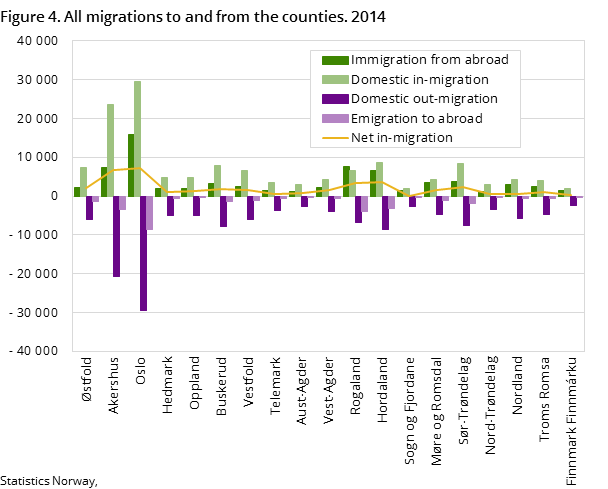
The number of migrations within municipalities (448 000) and between municipalities (238 000) were both at a record high. All counties had a net immigration, but net immigration from abroad offset the domestic migration loss and birth deficit in many counties. Additionally, seven per cent of those with an immigrant background migrated between municipalities, compared to four per cent among the rest of the population. In counties such as Østfold and Akershus, as well as municipalities such as Fredrikstad, Bærum, Ullensaker, Lørenskog and Skedsmo, this domestic immigration of persons with an immigrant background was vital for the migratory balance. In other areas, such as Vest-Agder, Sør-Trøndelag and Trondheim, on the other hand, domestic immigration of persons without any immigrant background in addition to direct immigration from abroad was the reason for the positive migratory balance.
Highest immigration still from Poland, Lithuania and Sweden
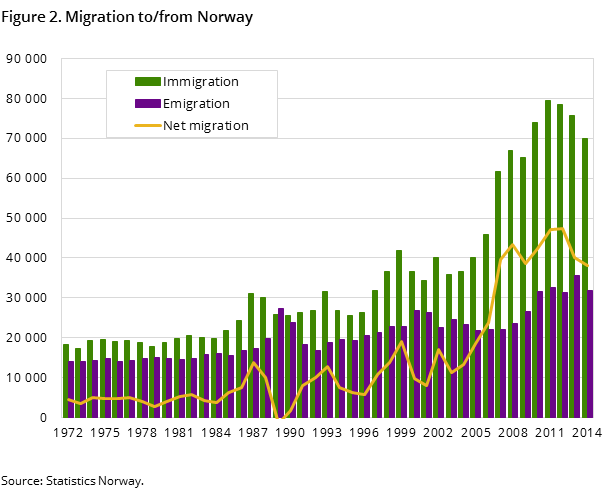
A total of 70 000 immigrations were registered in 2014; almost 10 000 fewer than in the peak year of 2011, but higher than in all the years preceding 2010. The number of foreign citizens immigrating was 61 400, and two thirds of these were European citizens. Since 2007, employment has been the main reason for immigration. Polish, Lithuanian and Swedish citizens constituted 18 900 or half of the European immigration. The Poles were the largest group, making up around half. For the Poles, as for the Swedes, this was a decrease of 600 compared to the previous year, and for the Lithuanians the corresponding decrease was 1 100. For European citizens combined, immigration was 3 900 lower.
Syrian citizens a new, large group
A total of 21 900 non-European citizens immigrated, many of whom were refugees. Citizens from Eritrea, Syria, Somalia and Afghanistan constituted 7 400 or one third of this non-European immigration. Immigration of Syrian citizens was at 2 100, up 1 300 from the previous year, making it the seventh largest group. As a comparison, 26 100 Syrian citizens came to Sweden in 2014. The non-European immigration also decreased in 2014, but the total immigration from the four aforementioned countries was at the same level as one year before.
Emigration is also large among Poles and Swedes
A total of 31 900 emigrations takes us back to the 2010-2012 level. Of the foreign citizens emigrating, 16 000 - or seven out of ten - had a European citizenship, and Swedish and Polish citizens were distinct groups, with 3 800 and 2 900 emigrations respectively. Lithuanian, German and Filipino citizens were other larger groups.
Reduced net immigration
Immigration and emigration decreased by 5 750 and 3 850 respectively, resulting in a net immigration of 38 150, which was 1 900 lower than the previous year. The 2014 figure is the lowest since 2006, and around 9 000 lower than in the peak years of 2011-2012. The net immigration of European citizens was 23 400, which was 2 300 lower than the previous year, while the net immigration of non-European citizens of 14 700 was 1 500 lower. Net immigration of Norwegian citizens was 50.
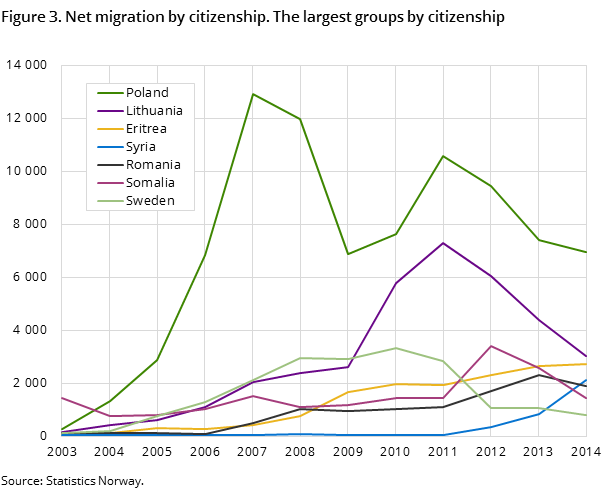
Net immigration for several of the largest groups varies from one year to another. Polish citizens reached a peak in 2007 with 12 900, but since then the number has decreased to 7 000 in 2014. Lithuanian citizens reached their peak in 2011 with 7 300, but has since decreased to 3 000 in 2014. Likewise, Swedish citizens reached a peak in 2010 with 3 300, but by 2014 had decreased to 800. The net immigration of Somali citizens has decreased markedly, while net immigration of Syrian and Eritrean citizens has increased.
Not all who registered as emigrated in 2014 actually left in 2014
The continuous relatively high number of emigrations partly relates to persons who emigrated a long time ago but who have failed to report their move to the population register. The Central Population Register of the Tax Administration in 2014 has continued its work to perform out-registrations of such people. These out-registrations constituted 36 per cent of all emigrations in 2014.
Most of these out-registrations were registered with an unknown country of destination. A large part of these out-registrations consisted of Polish, Lithuanian and Filipino citizens, as well as persons with an immigrant background from Somalia.
Domestic migration at an all-time high
The domestic migratory activity increased in 2014, reaching more than 238 000 cross-municipality migrations; the highest number ever and 3 000 more than in the previous peak year of 2013. Nine counties had a domestic migration gain, while ten had a loss. The counties Akershus, Østfold and Sør-Trøndelag had the largest gains, and Nordland the largest loss.
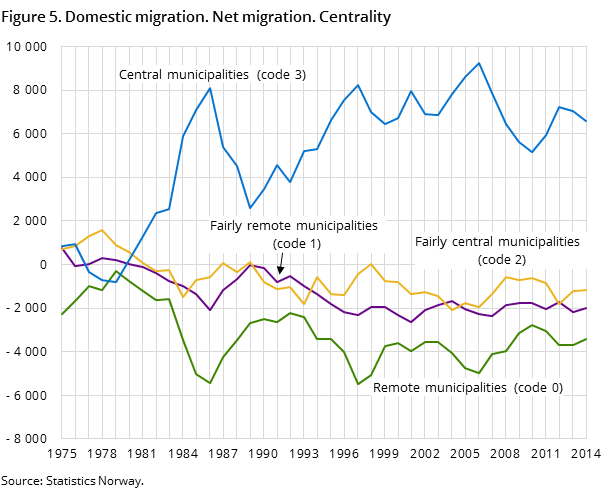
Migrations contributed to the further centralisation of settlement, and the central municipalities had a gain of 6 550, which was at the same level as for the last 30 years. The least central municipalities had the largest loss with 3 400, which is also the same level as previous years.
Most people migrated within their own municipality
Fifty-seven per cent of the total number of migrations, 448 000, took place within the boundaries of the municipality of residence, which was also a record high. Almost nine per cent of the inhabitants migrate in this way during a year. In Oslo, 90 000 migrations of this type took place, which amounts to 14 per cent, or every seventh inhabitant.
Contact
-
Statistics Norway's Information Centre
E-mail: informasjon@ssb.no
tel.: (+47) 21 09 46 42
-
Oppdrag befolkningsstatistikk
E-mail: befolkning@ssb.no
-
Even Høydahl
E-mail: even.hoydahl@ssb.no
tel.: (+47) 95 77 79 06
