Content
Published:
This is an archived release.
High growth in turnover for water supply, sewerage and waste
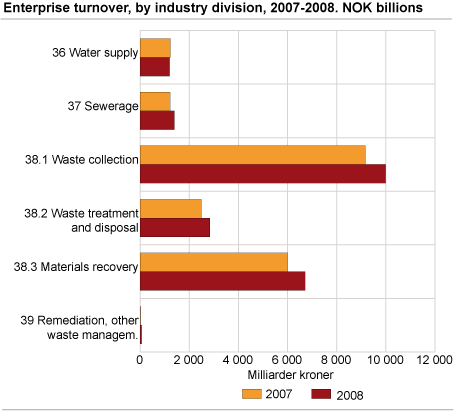
Enterprises within water supply, sewerage and waste had a total turnover of NOK 22.2 billion in 2008, which corresponds to an increase of 10 per cent compared to 2007.
Waste activities and materials recovery was the largest industry, and with a turnover of NOK 19.5 billion, made up 88 per cent of the total turnover.
Turnover within waste activities and materials recovery consists of NOK 10 billion from waste collection, NOK 2.8 billion from waste treatment and disposal and NOK 6.7 billion from materials recovery. Waste treatment had the highest growth in percentage from 2007 to 2008, with an upsurge in turnover of 14 per cent.
Highest number of persons employed within waste activities and materials recovery
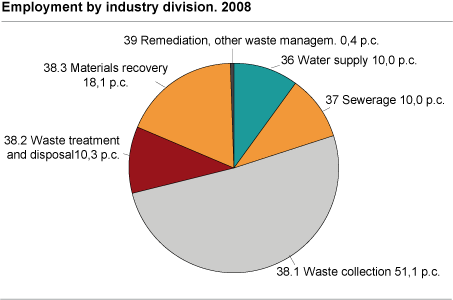
The number of persons employed within water supply, sewerage and waste in 2008 was 9 645. Eighty per cent of these were employed within waste activities and materials recovery. Of these, 64 per cent worked with waste collection, 13 per cent with waste treatment and disposal and the remaining 23 per cent worked with materials recovery.
Average wages and salaries per employee within the water supply, sewerage and waste industries was NOK 392 000 in 2008.
Enterprises within the public administration, social security administration, county authorities and local authorities are not included in the structural business statistics.
Preliminary figuresStructural data, preliminary figures, is published for the enterprise level alone, whereas the final figures are compiled also for the establishments. The figures for the enterprise will usually deviate from figures on establishment level. This is due to the fact that the enterprises are registered in the industry subclass that comprises the main part of the activity of the enterprise, and therefore may be registered in a different industry than some of the establishments. |
Important announcement: New industry classificationA new version of Norwegian industry classification (SIC2007) was implemented in January 2009. These are new structural business statistics as a new industry section for water supply, sewerage, waste management and remediation activities has been established. Industries in this new industry section were a part of either manufacturing, electricity, gas and water supply or other community and personal services in SIC2002. See table 3 for details. For more information about the transition to the new standard, click here. |
Tables:
- Table 1 Principal figures for enterprises, by industry division, SIC2007. Final figures 2007 and preliminary figures 2008
- Table 2 Principal figures for enterprises, by industry, SIC2002. Final figures 2007 and preliminary figures 2008
- Table 3 Correspondence table, industry section Water supply, sewerage and waste, SIC2007 to SIC2002
The statistics is now published as Business statistics.
Contact
-
Statistics Norway's Information Centre
E-mail: informasjon@ssb.no
tel.: (+47) 21 09 46 42


