Content
Published:
This is an archived release.
Greenhouse gas emissions greatly reduced in 2009
The national emissions of greenhouse gases amounted to 51.3 million tonnes of CO2 equivalents in 2009, a reduction of 4.6 per cent compared to 2008. The emission reductions in tonnes were greatest in manufacturing and mining industries and oil and gas extraction.
Emission figures on a detailed level are now published for national greenhouse gas emissions for the years 1990-2009. The Norwegian emission inventory is prepared by Statistics Norway in close collaboration with the Climate and Pollution Agency. The new calculations confirm that Norwegian greenhouse gas emissions were reduced from 2008 to 2009. The total reduction is however somewhat lower than indicated in the preliminary figures published in May 2010.
CO2 is the main contributor to emissions of greenhouse gases. In the period 1990-2007, the emissions of CO2 increased considerably, while there was an emission reduction in 2008 and 2009. The emissions of N2O and CH4 have been relatively stable in the period, while the emissions of PFK and SF6 have had a strong reduction. The emissions of HFK have however increased substantially since 1990.
| 2009 | Per cent change 1990-2009 | Per cent change 2008-2009 | |||||||||||||||||||||||||||||||||||||||||||||||||||||||||||||||||||||||||||||
|---|---|---|---|---|---|---|---|---|---|---|---|---|---|---|---|---|---|---|---|---|---|---|---|---|---|---|---|---|---|---|---|---|---|---|---|---|---|---|---|---|---|---|---|---|---|---|---|---|---|---|---|---|---|---|---|---|---|---|---|---|---|---|---|---|---|---|---|---|---|---|---|---|---|---|---|---|---|---|---|
| Totalt | 51.3 | 3 | -5 | ||||||||||||||||||||||||||||||||||||||||||||||||||||||||||||||||||||||||||||
| Oil and gas extraction1 | 13.7 | 76 | -7 | ||||||||||||||||||||||||||||||||||||||||||||||||||||||||||||||||||||||||||||
| Manufacturing and mining industries | 11.3 | -41 | -17 | ||||||||||||||||||||||||||||||||||||||||||||||||||||||||||||||||||||||||||||
| Energy supply | 1.8 | 453 | 128 | ||||||||||||||||||||||||||||||||||||||||||||||||||||||||||||||||||||||||||||
| Heating in other industries and households | 1.7 | -35 | 2 | ||||||||||||||||||||||||||||||||||||||||||||||||||||||||||||||||||||||||||||
| Road traffic | 9.8 | 26 | -3 | ||||||||||||||||||||||||||||||||||||||||||||||||||||||||||||||||||||||||||||
| Aviation | 1.2 | 24 | 3 | ||||||||||||||||||||||||||||||||||||||||||||||||||||||||||||||||||||||||||||
| Fishing vessels and coastal traffic | 3.6 | 11 | 7 | ||||||||||||||||||||||||||||||||||||||||||||||||||||||||||||||||||||||||||||
| Other mobile combustion | 1.9 | 26 | -8 | ||||||||||||||||||||||||||||||||||||||||||||||||||||||||||||||||||||||||||||
| Agriculture | 4.2 | -6 | -1 | ||||||||||||||||||||||||||||||||||||||||||||||||||||||||||||||||||||||||||||
| Other emissions | 2.2 | 5 | 4 | ||||||||||||||||||||||||||||||||||||||||||||||||||||||||||||||||||||||||||||
| 1 | Includes stationary combustion offshore and in onshore installations (mainly gas terminals). |
| Source: Emission inventory from Statistics Norway and the Climate and Pollution Agency. | |
Reduced emissions from oil and gas extraction
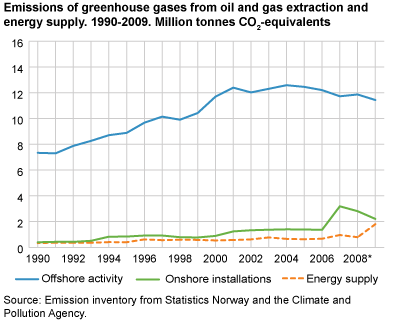
The emissions from oil and gas extractions decreased seven per cent from 2008 to 2009, but are still 76 per cent above the level in 1990. The emissions from offshore production plants still dominate the emissions from oil and gas extraction, but the declining trend that began around year 2000 is continuing. The emissions from onshore installations have increased in the period because of increased activity in gas terminals. In 2007 and 2008, emissions from gas terminals were particularly high due to start-up problems at the LNG plant at Hammerfest.
Emissions from energy supply increased considerably in 2009
Energy supply includes emissions from electricity production and district heating. The emissions from the production of electricity have previously been low since this sector has been dominated by water power. The start-up of the gas power plant at Kårstø increased the emissions considerably in 2009. The greenhouse gas emissions from district heating have more than doubled from 1990 to 2009, while the energy production more than tripled in the same period, according to the district heating statistics from Statistics Norway. The most important energy goods used in district heating is waste, but also woodchip and bark, electricity, oil and gas are important fuels for district heating. The estimated emission figures for the whole period are adjusted upwards for the district heating plants.
Reduced emissions from road traffic
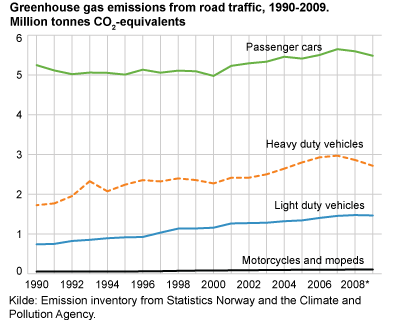
The greenhouse gas emissions from road traffic increased by 26 per cent in the period 1990-2009, in spite of a reduction of four per cent from 2007 to 2009. There has been a reduction in the emissions from both passenger cars (including taxis) and heavy vehicles, while the emissions from other light vehicles (e.g. vans and mini buses under 3.5 tonnes) continue to increase. The diesel sale has increased every year during the whole period 1990-2009, and in spite of reduced sales of petrol from 2001, total fuel sales to transport increased until 2007. In 2008 and 2009 there was, however, a decrease also in the total fuel sale. According to the sales statistics for petroleum products , the sale of fuels for transport has increased again in 2010. This may indicate that the reduced sales in 2008 and 2009 were a temporary effect of lower economic activity in these two years. Sales in 2010 indicate a continuation of the increasing trend for fuel consumption in road traffic since 1990.
Since the last publication, Statistics Norway has started using a new model for calculating emissions from road traffic. Revised emission factors in the model have resulted in higher estimated emissions of N2O and CH4 in the beginning of the time series and lower estimated emissions in the end of the time series. However, these gases together constituted only 1.7 per cent of the greenhouse gas emissions from road traffic in 1990 and 0.8 per cent in 2009.
Norway and the Kyoto ProtocolNorway’s allocated quota from the UN amounts to 50.1 million tonnes of CO2 equivalents per year in the period 2008-2012; 1 per cent more than Norwegian emissions in 1990. The emissions for the years 2008 and 2009 exceed the allocated quota, but Norway is still in a good position to fulfil the obligation. This is because Norway is part of the EU ETS system. In addition, Norway has been credited for emission reductions by the flexibility mechanisms CDM and JI. Industries included in the quota trading system deliver quotas to the State corresponding to their emissions (partly received for free from the State and partly bought in the EU ETS system). These delivered quotas exceed the Norwegian State’s delivery to the EU ETS. This surplus more than offsets the need arising when Norway’s emissions exceed the assigned amounts from the UN. |
Carbon removals in forestThe emission inventory annually reported to the UN also includes emissions and removals of greenhouse gases in forests. According to estimations performed by the Norwegian Forest and Landscape Institute, net removal in 2008 was about 31 million tonnes of CO2 in Norwegian forests, which corresponds to over 60 per cent of the yearly greenhouse gas emissions in CO2 equivalents. According to the Kyoto agreement, Norway can credit about 1.5 million tonnes for removals in forest per year in the period 2008-2012. |
About the emission inventoryRead more about: - documentation of the emission accounts . - emission figures for nitrogen oxides, sulphur dioxide, ammonia, NMVOC and CO - statistics on emission intensity |
Tables:
- Table 1 Emissions to air by source. 1990
- Table 2 Emissions to air by source. 2008
- Table 3 Emissions to air by source. 2009*
- Table 4 Emissions to air of greenhouse gases. 1973-2009*
- Table 5 Emissions to air of greenhouse gases by industry. 1990, 2008 and 2009. 1 000 tonnes CO2equivalents. Change in per cent
This page has been discontinued, see Emissions to air, Annually.
Contact
-
Trude Melby Bothner
E-mail: trude.melby.bothner@ssb.no
tel.: (+47) 40 81 14 25
-
Berit Storbråten
E-mail: berit.storbraten@ssb.no
tel.: (+47) 40 81 14 23


