Centre left still favoured by women
Published:
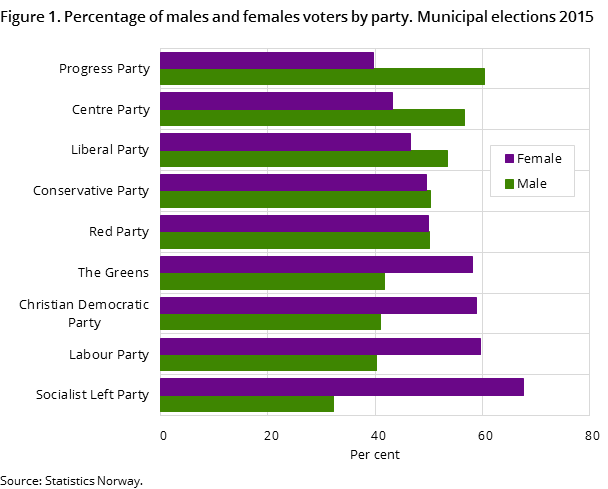
The Labour Party, Socialist Left Party and the Red party received 44 per cent of the votes from women in the municipal elections in 2015. If we add the Centre Party, more than half of the female electorate voted for the Centre left. The Conservative Party and the Progress Party fair better among men, with a 37 per cent share of male voters in the recent local elections.
- Full set of figures
- Municipal and county council election, electoral survey
6 out of 10 Progress Party voters are men
Election surveys have previously shown that the Progress Party has relatively more male voters than female, while Labour and the Socialist Left Party are strongest among women. In the municipal elections in 2015, we see the same tendency. Six out of 10 Progress Party voters are men, while nearly 7 out of 10 Socialist Left Party voters are women. Six out of 10 Labour voters are women. Among voters for the Christian Democratic Party and the Green Party, the majority are women, while men make up the majority for the Centre Party and the Liberal Party. Slightly more men than women voted for the Conservative Party in these elections.
Labour still the largest party among immigrants
Earlier surveys among voters with immigrant backgrounds have shown that Labour is the largest party among these. Among immigrants who are Norwegian citizens and Norwegian-born citizens with immigrant parents, nearly 6 out of 10 vote for Labour. Among foreign citizens, however, only 30 per cent report having voted for Labour. The Conservative Party is relatively strong among this group, with 29 per cent of foreign nationals voting for this party. The Green Party is also relatively strong among foreign nationals, with a 7 per cent share of the votes.
1 out of 10 foreign citizens did not think they were eligible to vote
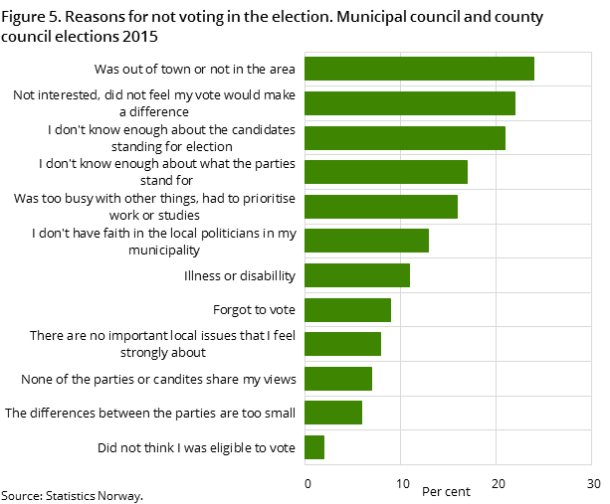
Among foreign citizens, 12 per cent said they did not believe they had the right to vote as the reason for not voting. Among Norwegian citizens, including voters with immigrant backgrounds, almost no one reported the same.
Contact
-
Øyvin Kleven
-
Tove Bergseteren
-
Statistics Norway's Information Centre

