Content
Published:
This is an archived release.
Stagnation within manufacturing
Turnover for mining, quarrying and manufacturing increased from NOK 670 billion to NOK 676 billion from 2009 to 2010. This equals an increase of 0.9 per cent and came after a large drop from 2008 to 2009.
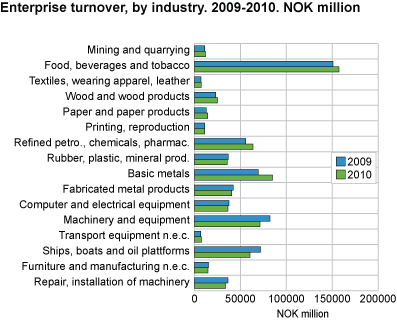
Turnover within manufacturing increased by close to NOK 5 billion, while turnover in mining and quarrying grew by approximately NOK 1 billion. Food, beverages and tobacco was the industry with the highest turnover in 2010 and accounted for 24 per cent of the total turnover within manufacturing.
Growth for metals and decline for ships
Manufacturing of basic metals increased the most, as turnover went up by NOK 15.6 billion or 22 per cent. Manufacturing of refined petroleum products, chemicals and pharmaceuticals had an increase in turnover of NOK 7.9 billion or 14 per cent.
The largest decline was found within manufacturing of ships and boats, where turnover fell by NOK 11.6 billion or 16 per cent. Turnover within manufacturing of machinery and equipment fell by NOK 11 billion or 13 per cent.
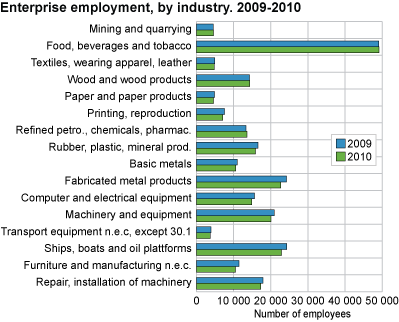
Fewer employees within manufacturing
The number of persons employed within mining, quarrying and manufacturing went from 245 000 in 2009 to 237 000 in 2010; a decline of 3 per cent. The largest falls were found in the metal products industry and manufacturing of ships and boats.
Preliminary figuresPreliminary figures for structural business statistics are only published for enterprises and with fewer variables than for final figures. Final figures are published within 18 months after the end of the reference period. |
Tables:
The statistics is now published as Business statistics.
Contact
-
Statistics Norway's Information Centre
E-mail: informasjon@ssb.no
tel.: (+47) 21 09 46 42