Content
Published:
This is an archived release.
Higher oil prices ensured increase in value added
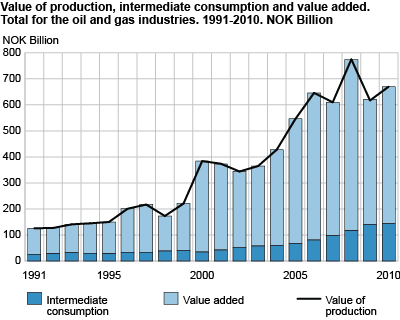
The value added in the Norwegian oil and gas sector amounted to NOK 526 billion in 2010, an increase of 9 per cent from 2009. The increase came as a consequence of higher oil prices.
The oil and gas activity in Norway consists of the extraction of crude oil and natural gas, service activities incidental to oil and gas extraction and pipeline transport. The production value for these three industries amounted to NOK 670 billion in 2010, an increase of nearly 9 per cent from 2009. The intermediate consumption showed a mild increase of 3 per cent and amounted to NOK 144 billion in 2010. This resulted in a value added of NOK 526 billion for 2010, up NOK 44 billion or 9 per cent from 2009.
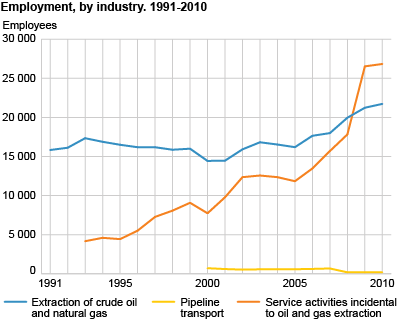
The oil and gas industry employed around 48 750 people in 2010, an increase of nearly 2 per cent from 2009. Total wage costs increased by 3 per cent, to NOK 54 billion in 2010.
Service industry biggest employer, extraction industry biggest value creator
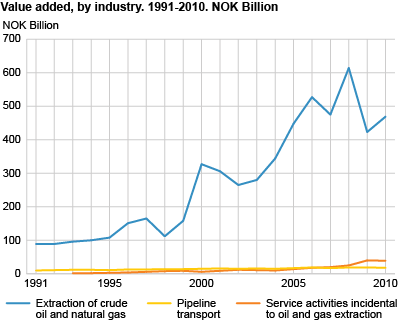
Around 89 per cent of the total value added from the three oil and gas industries stems from the extraction industry. Even though this industry is by far the biggest when it comes to value added, the industry employed only 45 per cent of the total number of people working in the three oil and gas industries. The service industry was the biggest employer in 2010, with a share of 55 per cent.
Higher oil prices led to increase in value added
Despite a fall in total production of petroleum products in the extraction industry, the gross value of production increased by 9 per cent, and amounted to NOK 549 billion in 2010. The increase in production value was mainly caused by an increase in the oil price of 26 per cent from 2009 to 2010. Even though the production of oil, NGL and condensate declined from 2009 to 2010, higher prices ensured an increase in the production value for these productions. The production value of natural gas, on the other hand, showed a mild decrease. Even though the production increased slightly, a fall in the price of natural gas of 5 per cent led to a small decrease in the value for this product. See also Production and reserves .
The intermediate consumption in the extraction industry constitutes a relatively small share of the production value, only 15 per cent in 2010. The total intermediate consumption increased by less than 1 per cent from 2009 to 2010, and amounted to NOK 81 billion. This led to an increase in the value added of 11 per cent from 2009 to 2010, and resulted in a value added of nearly NOK 459 billion. Despite an increase in the value added from 2009 to 2010, the amount was still lower than for the years 2006, 2007 and 2008.
The investments in the extraction industry amounted to NOK 125 billion in 2010, an increase of nearly 8 per cent from 2009. The decline was mainly due to lower investments in field development, see Investment statistics .
Small decline in value added in the oil service industry
The service industry includes drilling and technical services directly related to the extraction activity.
In 2010, the gross value of production amounted to nearly NOK 100 billion; a small increase of NOK 3 billion from 2009. The intermediate consumption, however, showed a sharper increase than the production value, and increased by nearly NOK 4 billion from 2009. This resulted in a small decline in the value added of NOK 0.7 billion, or 2 per cent from 2009 to 2010. This corresponds to a value added in 2010 of NOK 39.1 billion, while the corresponding figure for 2009 was NOK 39.8 billion.
Marginal decrease in pipeline transport
The gross value of production in the pipeline transport industry mainly consists of transport tariffs paid by operators and licensees for transportation of oil and gas. In 2010, the gross value of production in the pipeline industry increased by 1 per cent, and amounted to NOK 21 billion in 2010. With an intermediate consumption of NOK 2.4 billion, value added amounted to NOK 18.4 billion. This is a 0.6 per cent decrease from 2009.
Tables:
Additional information
Contact
-
Maria Asuncion Campechano
E-mail: maria.campechano@ssb.no
tel.: (+47) 40 81 14 21
-
August Meland
E-mail: august.meland@ssb.no
tel.: (+47) 46 42 33 21


