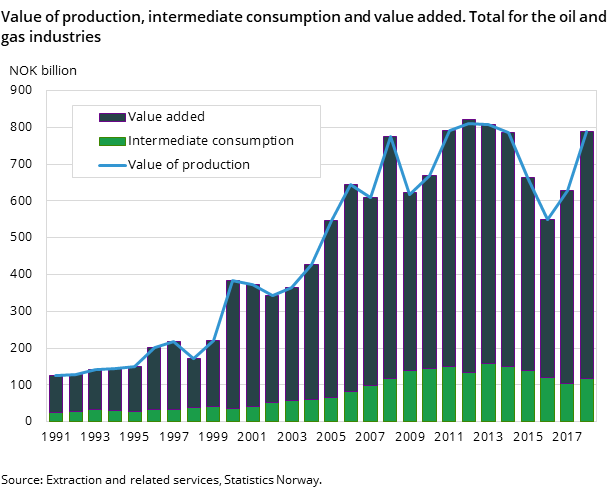
Increased production value – a temporary reprieve for the extraction industries
Published:
The Norwegian oil- and gas industry had its second good year in a row because of higher oil- and gas prices in 2018. However, production is still decreasing, and the extraction industries are not showing signs of preparing for increased activity in the future. The support industries on the other hand seem to be betting on a slightly brighter tomorrow.
- Full set of figures
- Extraction and related services
- Series archive
- Extraction and related services (archive)
Preliminary figures for extraction and related services show an increase in production value of 25.2 percent, from 629 billion in 2017 to 788 billion in 2018. The increase comes as a result of increased oil- and gas prices, while the decrease in production volume has been moderate.
Because of the price increase the value added in the extraction industries also increased sharply. In recent years reduced costs, measured by intermediate consumption, have contributed to this increase. However, in 2018 intermediate consumption has gone up by 14 percent.
Figure 2. Value added, by industry
| 1991 | 1992 | 1993 | 1994 | 1995 | 1996 | 1997 | 1998 | 1999 | 2000 | 2001 | 2002 | 2003 | 2004 | 2005 | 2006 | 2007 | 2008 | 2009 | 2010 | 2011 | 2012 | 2013 | 2014 | 2015 | 2016 | 2017 | 2018 | |
| Extraction of oil and natural gas, incl. transport via pipelines | 99.56 | 99.82 | 107.52 | 112.64 | 119.37 | 163.74 | 177.56 | 126.21 | 171.96 | 342.16 | 322.31 | 279.73 | 295.86 | 359.29 | 465.22 | 546.65 | 491.69 | 633.14 | 441.89 | 486.93 | 600.98 | 648.08 | 600.91 | 587.25 | 473.64 | 389.63 | 493.17 | 636.97 |
| Support activities for petroleum and natural gas extraction | 1.96 | 2.15 | 2.61 | 3.67 | 6.23 | 7.56 | 8.60 | 6.41 | 9.11 | 11.94 | 10.96 | 9.92 | 14.31 | 17.88 | 20.43 | 25.26 | 39.75 | 39.05 | 39.51 | 41.07 | 49.43 | 50.46 | 49.89 | 38.57 | 32.05 | 32.82 |
Despite the extraction industries having a great year on the income side employment remained stable compared to the previous year. This is in keeping with the sectors focus on downsizing in recent years, and bears witness that this year’s result might be a swan song for the extraction industries rather than a return to previous greatness.
Positive signs from the support industries
For a long time, the support industries have had higher employment, despite accounting for a much smaller part of the production value, compared to the extraction industries. Employment in the support industries has also been less stable and appears to be affected more by the ups and downs of the market.
In 2017 both production value and employment fell in the support industries, despite the high oil- and gas prices. For employment this was a continuation of a negative trend that started in 2015, and which has continued uninterrupted until now. However, in 2018 production value increased by 9.3 percent, and employment by an impressive 17.2 percent.
Figure 3. Employment, by industry
| 1991 | 1992 | 1993 | 1994 | 1995 | 1996 | 1997 | 1998 | 1999 | 2000 | 2001 | 2002 | 2003 | 2004 | 2005 | 2006 | 2007 | 2008 | 2009 | 2010 | 2011 | 2012 | 2013 | 2014 | 2015 | 2016 | 2017 | 2018 | |
| Extraction of oil and natural gas, incl. transport via pipelines | 15830 | 16119 | 17338 | 16878 | 16498 | 16185 | 16183 | 15865 | 15998 | 15154 | 15079 | 16450 | 17396 | 17119 | 16780 | 18276 | 18675 | 20150 | 21433 | 21930 | 23869 | 25625 | 27159 | 27258 | 26470 | 25357 | 23840 | 23814 |
| Support activities for petroleum and natural gas extraction | 4173 | 4603 | 4437 | 5517 | 7280 | 8080 | 9082 | 7743 | 9786 | 12358 | 12569 | 12357 | 11841 | 13470 | 15697 | 17819 | 26523 | 26828 | 30754 | 31421 | 35676 | 36814 | 33282 | 29182 | 25485 | 29860 |
Contact
-
Maria Asuncion Campechano
-
Magnus Dybwik Larsen
-
Statistics Norway's Information Centre

