From the publication of the January index (7 March 2024) and onwards, the base year is changed to 2021=100. Until December 2023 the base year was 2005=100.
This updating will not influence the changes in the index over time. However, there may be some round-off effects which may move a decimal up or down.
Index of industrial production
Updated: 8 April 2024
Next update: 8 May 2024
| Index of production. Seasonally adjusted | Index of production. Calendar adjusted1 | Weights2 | ||
|---|---|---|---|---|
| Monthly change | Three-month change | Twelve-month change | ||
| February 2024 / January 2024 | December 2023 - February 2024 / September 2023 - November 2023 | February 2024 / February 2023 | ||
| Extraction, mining, manufacturing and elec | -4.3 | 7.0 | 1.8 | 100.0 |
| Extraction and related services | -4.8 | 9.7 | 2.4 | 83.2 |
| Mining and quarrying | 6.6 | -8.6 | -12.7 | 0.2 |
| Manufacturing | -1.1 | -0.3 | -2.2 | 9.8 |
| Food, beverage and tobacco | 0.1 | -0.4 | -1.7 | 1.9 |
| Refined petro., chemicals, pharmac. | -5.1 | -2.0 | -9.9 | 1.4 |
| Basic metals | -0.7 | 1.3 | -2.2 | 1.1 |
| Machinery and equipment | -1.1 | -0.3 | -2.3 | 0.7 |
| Ships, boats and oil platforms | -0.2 | 5.1 | 13.6 | 0.6 |
| Electricity, gas and steam | -2.3 | -5.7 | 1.7 | 6.8 |
| 1Adjusted for working-days and for public holidays in Norway. | ||||
| 2The weights are updated annually, and are valid for the entire year. | ||||
Selected tables and charts from this statistics
- Index of production. Monthly numbers, by division and main industrial groupings. Seasonally adjusted series. 2021=100Download table as ...
 Index of production. Monthly numbers, by division and main industrial groupings. Seasonally adjusted series. 2021=1001 2
February 2024 Monthly change in per cent December 2023 / November 2023 January 2024 / December 2023 February 2024 / January 2024 Extraction, mining, manufacturing and electricity 101.8 1.5 2.2 -4.3 Extraction and related services 102.7 2.4 1.7 -4.8 Extraction of crude petroleum 98.3 0.8 -0.1 -3.8 Extraction of natural gas 105.5 1.9 0.4 -4.5 Support act. petroleum extraction 116.4 0.9 1.3 1.6 Manufacturing, mining and quarrying 98.6 -0.1 -0.1 -1.2 Mining and quarrying 92.2 -9.4 -10.4 6.6 Manufacturing 98.8 0.1 0.0 -1.1 Food, beverage and tobacco 94.6 0.5 -0.5 0.1 Food products 93.9 0.5 -0.4 -0.1 Textiles, wearing apparel, leather 107.4 2.8 -0.6 -0.7 Wood and wood products 79.1 -1.5 0.1 1.2 Paper and paper products 90.0 8.6 -1.9 0.3 Printing, reproduction 96.9 -3.0 2.5 -0.8 Refined petro., chemicals, pharmac. 88.7 1.5 -2.0 -5.1 Basic chemicals 93.2 0.9 -2.1 7.2 Rubber, plastic and mineral prod. 77.8 -0.6 -2.3 -3.8 Basic metals 91.7 0.2 -2.4 -0.7 Non-ferrous metals 89.9 -2.2 1.7 0.6 Fabricated metal products 112.5 0.4 -0.1 0.5 Computer and electrical equipment 108.5 -0.1 1.8 -3.6 Machinery and equipment 105.8 -0.2 -0.6 -1.1 Ships, boats and oil platforms 137.0 3.4 0.4 -0.2 Transport equipment n.e.c 106.9 1.4 -1.7 -3.3 Repair, installation of machinery 110.5 -0.5 1.1 -0.1 Furniture and manufacturing n.e.c. 79.2 -5.7 1.4 -1.6 Electricity, gas and steam 95.6 -5.0 3.9 -2.3 Main indstrial groupings: Intermediate goods 100.0 0.7 0.1 0.9 Capital goods 116.1 1.0 -0.1 0.0 Consumer goods 92.7 1.4 -1.7 -2.0 Durable consumer goods 68.6 -7.4 0.7 -4.5 Non-durable consumer goods 95.2 2.2 -1.8 -1.7 Energy goods 100.2 0.9 2.1 -4.0 1The weights are value added at factor prices. 2The levels of aggregation refers to the Standard of Industrial Classification (SIC2007). See NOS D383 for further details Explanation of symbolsDownload table as ... - Index of production. Period numbers, by division and main industrial groupings. Seasonally adjusted. 2021=100Download table as ...Index of production. Period numbers, by division and main industrial groupings. Seasonally adjusted. 2021=1001 2
Three-month average Three-month change in per cent December 2023 - February 2024 June 2023 - August 2023 / March 2023 - May 2023 September 2023 - November 2023 / June 2023 - August 2023 December 2023 - February 2024 / September 2023 - November 2023 Extraction, mining, manufacturing and electricity 104.1 0.2 -3.6 7.0 Extraction and related services 105.6 -0.2 -4.5 9.7 Extraction of crude petroleum 100.9 0.8 -2.0 -0.6 Extraction of natural gas 108.7 -4.4 -4.2 15.4 Support act. petroleum extraction 114.7 1.7 0.9 2.8 Manufacturing, mining and quarrying 99.4 0.1 -0.5 -0.4 Mining and quarrying 91.7 -0.3 -0.3 -8.6 Manufacturing 99.5 0.2 -0.5 -0.3 Food, beverage and tobacco 94.7 1.0 -1.5 -0.4 Food products 94.1 1.8 -1.8 -0.5 Textiles, wearing apparel, leather 108.2 3.5 -0.4 2.1 Wood and wood products 78.5 -2.4 -2.1 -2.5 Paper and paper products 90.4 -1.6 -1.7 5.6 Printing, reproduction 96.6 2.0 -4.4 -2.3 Refined petro., chemicals, pharmac. 92.5 -1.3 -1.6 -2.0 Basic chemicals 89.6 -1.8 -0.8 4.3 Rubber, plastic and mineral prod. 80.5 -1.6 -3.9 -4.4 Basic metals 92.9 -0.9 -0.2 1.3 Non-ferrous metals 89.1 -1.4 -1.8 0.6 Fabricated metal products 112.1 3.1 0.6 0.8 Computer and electrical equipment 110.5 2.4 2.9 0.0 Machinery and equipment 106.8 -0.4 -1.0 -0.3 Ships, boats and oil platforms 137.0 4.4 1.8 5.1 Transport equipment n.e.c 110.0 1.6 -0.4 -1.3 Repair, installation of machinery 110.2 2.3 -0.4 0.5 Furniture and manufacturing n.e.c. 79.7 1.5 -1.3 -5.6 Electricity, gas and steam 95.9 3.4 -0.5 -5.7 Main indstrial groupings: Intermediate goods 99.4 -0.2 0.4 0.8 Capital goods 116.1 2.1 0.3 1.5 Consumer goods 94.5 0.6 -2.0 -0.9 Durable consumer goods 70.6 0.0 -0.1 -9.6 Non-durable consumer goods 96.9 0.8 -2.2 -0.1 Energy goods 102.3 0.1 -4.3 7.5 1The weights are value added at factor prices. 2The levels of aggregation refers to the Standard of Industrial Classification (SIC2007). See NOS D383 for further details. Explanation of symbolsDownload table as ... - Index of production. Period numbers, by division and main industrial groupings. Calendar adjusted series. 2021=100Download table as ...Index of production. Period numbers, by division and main industrial groupings. Calendar adjusted series. 2021=1001 2 3
February 2024 Twelve-month change December 2023 / December 2022 January 2024 / January 2023 February 2024 / February 2023 Extraction, mining, manufacturing and electricity 100.7 7.8 8.3 1.8 Extraction and related services 100.6 7.1 8.8 2.4 Extraction of crude petroleum 92.6 6.0 4.8 -1.1 Extraction of natural gas 104.8 6.3 7.3 1.3 Support act. petroleum extraction 112.3 2.3 3.9 9.8 Manufacturing, mining and quarrying 96.0 0.4 -0.7 -2.5 Mining and quarrying 82.3 -1.9 -21.0 -12.7 Manufacturing 96.4 0.6 -0.4 -2.2 Food, beverage and tobacco 85.4 -1.5 -2.4 -1.7 Food products 84.9 -1.9 -2.0 -2.0 Textiles, wearing apparel, leather 108.4 10.8 6.3 2.0 Wood and wood products 78.1 -11.5 -13.2 -7.9 Paper and paper products 87.2 -4.5 -8.0 -3.2 Printing, reproduction 95.2 -7.6 -5.1 -5.6 Refined petro., chemicals, pharmac 88.1 -4.1 -2.3 -9.9 Basic chemicals 90.3 -3.6 -2.3 9.5 Rubber, plastic and mineral prod. 72.3 -11.8 -13.9 -16.6 Basic metals 89.7 3.6 -0.6 -2.2 Non-ferrous metals 87.9 -5.0 -3.2 -3.3 Fabricated metal products 116.4 6.7 1.4 4.8 Computer and electrical equipment 107.8 9.5 9.2 1.5 Machinery and equipment 109.0 2.8 -1.1 -2.3 Ships, boats and oil platforms 139.6 16.6 15.0 13.6 Transport equipment n.e.c 108.7 7.6 2.4 -3.0 Repair, installation of machinery 110.5 4.0 5.7 2.7 Furniture and manufacturing n.e.c. 81.0 -8.5 -6.4 -7.3 Electricity, gas and steam 108.7 -5.4 10.4 1.7 Main indstrial groupings: Intermediate goods 96.0 -1.3 -3.5 1.5 Capital goods 118.2 9.4 5.8 4.7 Consumer goods 88.5 -1.0 -2.9 -5.0 Durable consumer goods 70.3 -13.9 -11.9 -15.2 Non-durable consumer goods 90.2 0.3 -1.8 -4.1 Energy goods 99.6 3.6 7.5 1.2 1The weights are value added at factor prices. 2The levels of aggregation refers to the Standard of Industrial Classification (SIC2007). See NOS D383 for further details. 3Adjusted for working-days and for public holidays. Explanation of symbolsDownload table as ... - Index of production. Period numbers, by division and main industrial groupings. Unadjusted series. 2021=100Download table as ...Index of production. Period numbers, by division and main industrial groupings. Unadjusted series. 2021=1001 2
February 2024 Twelve-month change December 2023 / December 2022 January 2024 / January 2023 February 2024 / February 2023 Extraction, mining, manufacturing and electricity 103.6 7.2 8.1 5.6 Extraction and related services 103.7 7.1 8.8 6.7 Extraction of crude petroleum 95.7 6.0 4.8 3.3 Extraction of natural gas 107.7 6.3 7.3 5.0 Support act. petroleum extraction 112.3 2.3 3.9 9.8 Manufacturing, mining and quarrying 99.3 -2.8 -0.6 1.5 Mining and quarrying 86.4 -7.7 -22.0 -7.1 Manufacturing 99.6 -2.6 -0.2 1.7 Food, beverage and tobacco 88.2 -4.6 1.0 2.3 Food products 87.6 -4.6 1.1 2.0 Textiles, wearing apparel, leather 110.3 -0.9 6.1 4.3 Wood and wood products 81.2 -17.9 -13.6 -3.3 Paper and paper products 88.4 -1.2 -8.4 -1.4 Printing, reproduction 97.6 -9.2 -5.2 -2.7 Refined petro., chemicals, pharmac. 89.7 2.2 -6.0 -7.8 Basic chemicals 91.3 -3.6 -2.3 11.1 Rubber, plastic and mineral prod. 73.5 -16.8 -14.1 -15.0 Basic metals 93.7 4.7 0.9 3.4 Non-ferrous metals 90.3 -5.0 -3.2 0.2 Fabricated metal products 119.7 1.9 1.9 8.4 Computer and electrical equipment 111.7 3.4 8.1 5.8 Machinery and equipment 112.9 -3.9 -0.4 2.0 Ships, boats and oil platforms 143.5 8.3 12.4 17.5 Transport equipment n.e.c 111.5 1.7 2.6 0.0 Repair, installation of machinery 114.1 -1.1 5.2 6.8 Furniture and manufacturing n.e.c. 84.8 -14.6 -5.1 -1.9 Electricity, gas and steam 110.3 -5.4 10.4 3.7 Main indstrial groupings: Intermediate goods 97.7 -3.6 -2.5 3.3 Capital goods 121.6 2.4 5.5 8.3 Consumer goods 91.8 -4.3 -0.7 -0.6 Durable consumer goods 73.0 -17.4 -9.9 -11.1 Non-durable consumer goods 93.5 -2.9 0.3 0.2 Energy goods 102.9 4.7 8.7 5.6 1The weights are value added at factor prices. 2The levels of aggregation refers to the Standard of Industrial Classification (SIC2007). See NOS D383 for further details. Explanation of symbolsDownload table as ... - Index of production. Weights, by division and main industrial groupingsDownload table as ...Index of production. Weights, by division and main industrial groupings1 2
2020 2021 2022 2023 2024 Extraction, mining, manufacturing and electricity 1 000.0 1 000.0 1 000.0 1 000.0 1 000.0 Extraction and related services 668.7 652.0 588.7 753.1 831.7 Extraction of crude petroleum 303.5 380.5 319.1 263.3 222.2 Extraction of natural gas 326.0 227.0 201.3 454.9 588.9 Support act. petroleum extraction 39.1 44.5 68.3 34.9 20.5 Manufacturing, mining and quarrying 257.4 262.4 334.8 174.9 100.5 Mining and quarrying 6.7 7.3 9.1 5.1 2.1 Manufacturing 250.7 255.2 325.7 169.8 98.4 Food, beverage and tobacco 56.6 64.1 76.9 34.8 19.0 Food products 52.1 59.3 70.1 31.3 17.4 Textiles, wearing apparel, leather 3.7 3.5 5.6 3.2 1.4 Wood and wood products 10.4 11.3 15.0 9.6 3.9 Paper and paper products 3.3 4.0 5.4 2.7 1.5 Printing, reproduction 4.2 3.2 3.6 2.3 1.1 Refined petro., chemicals, pharmac. 31.9 32.0 38.7 20.1 13.5 Basic chemicals 11.6 14.5 17.5 10.5 6.3 Rubber, plastic and mineral prod. 16.8 17.4 22.8 11.0 5.6 Basic metals 16.5 12.7 21.1 10.5 10.6 Non-ferrous metals 11.4 8.3 14.3 6.4 8.0 Fabricated metal products 20.8 21.2 27.7 15.5 8.9 Computer and electrical equipment 17.6 18.8 23.9 13.3 7.8 Machinery and equipment 20.3 20.1 24.0 13.1 7.1 Ships, boats and oil platforms 16.3 14.2 18.9 10.9 6.3 Transport equipment n.e.c 4.3 4.1 4.3 3.3 1.4 Repair, installation of machinery 20.8 21.0 27.7 14.4 7.6 Furniture and manufacturing n.e.c. 6.9 7.6 9.9 5.1 2.7 Electricity, gas and steam 73.9 85.5 76.5 72.0 67.8 Main indstrial groupings: Intermediate goods 134.0 143.0 199.7 105.4 62.5 Capital goods 82.0 79.7 101.5 56.4 31.2 Consumer goods 76.0 82.9 101.2 47.4 24.2 Durable consumer goods 5.3 5.8 7.8 4.0 1.9 Non-durable consumer goods 70.7 77.1 93.4 43.4 22.3 Energy goods 708.0 694.4 597.6 790.7 882.0 1The weights are value added at factor prices. 2The levels of aggregation refers to the Standard of Industrial Classification (SIC2007). See NOS D383 for further details Explanation of symbolsDownload table as ...
About the statistics
The primary goal of the Index of Industrial Production is to monitor the development of added value within oil and gas extraction, manufacturing, mining & quarrying, and electricity supply. The indicators used to measure value added are physical output and number of hours worked.
Long-term indices: Long-term indices are published together with reviewed figures on the Internet for the overall index, aggregates, main activities and main industrial groupings.
Local unit (establishment): An enterprise or part of an enterprise that is located in one particular place and can be identified geographically.
Enterprise: The smallest combination of legal units that is an organisational unit producing goods or services and that benefits from a certain degree of autonomy in decision-making.
NACE: Standard for industrial classification used by EUROSTAT. Based on the UN's international standard for industrial classification, ISIC Rev. 4.
Standard Industrial Classification 2007 (SIC2007) , which is a Norwegian adaptation of EUROSTAT's NACE Rev. 2. SIC2007 forms the basis for coding units according to principal activity in the Central Register of Establishments and Enterprises.
Processing level: The most detailed level of the statistics.
Unadjusted figures (original series): Raw data figures with primary information from the respondent.
Calender adjusted series (pre-adjusted series): Adjusted for working-days, moving holidays and fixed public holidays in Norway.
Seasonally adjusted figures: Pre-adjusted series for which seasonal effects have been removed (included length of month). X12-ARIMA is used to calculate these figures.
Imputation: An estimated value for a missing observation.
The survey is classified according to the Standard Industrial Classification 2007 (SIC2007). This is a Norwegian adaptation of NACE Rev. 2. SIC2007 forms the basis for classifying units according to principal activity in the Central Register of Establishments and Enterprises (CRE). The use of common standards is essential in order to enable the comparison and analysis of statistical data at national/international level and over time.
The survey is also classified according to EUROSTAT's end-use categories (Main Industrial Groupings, MIG). The end-use categories (MIGs) are based on the 3-digit level industrial groupings in SIC 2007. Six end-use categories are included in the survey:
MIG Code | Description |
E1 | Intermediate goods |
E2 | Capital goods |
E3 | Consumer durables |
E4 | Consumer non-durables |
E5 | Consumer goods (E3+E4) |
E6 | Energy goods |
The following table summarises the most important industries included in the different end-use categories:
MIG | Main industries included |
Intermediate goods | Support activities for oil and gas extraction, wood and wood products, Pulp, paper and paper products, Basic chemicals and Basic metals |
Capital goods | Fabricated metal products, Machinery and equipment and Building of ships, oil platforms and modules |
Consumer durables | Production of furniture |
Consumer non-durables | Food products, Printing and reproduction and Pharmaceuticals |
Consumer goods (E3+E4) | Food products, Printing and reproduction, Pharmaceuticals and Production of furniture |
Energy goods | Oil and gas extraction, Refined petroleum products and Electricity, gas and steam supply |
For a complete description of the industries covered by each MIG, see Commission regulation (EC) No 656/2007 or KLASS in the following link: https://www.ssb.no/en/klass/klassifikasjoner/6/varianter/1121.
The objective of this classification is to provide an activity breakdown of NACE, which is an intermediate level between the Sections (for example C: Manufacturing) and the Subsections (for example CA: Manufacture of food products, beverages and tobacco). The classification of the different units is based on the application of the produced products. It should be noted that the MIGs are not comparable in size, and the consumer durables heading in particular is smaller than the others.
Name: Index of industrial production
Topic: Energy and manufacturing
Division for Business Cycle Statistics
National level only
Monthly. Published approximately 35 days after the end of the relevant month.
The Index of Industrial Production is reported to EURO STAT and IMF on a monthly basis. The figures are also transmitted to OECD via Eurostat.
Collected and revised data are stored securely by Statistics Norway in compliance with applicable legislation on data processing.
Statistics Norway can grant access to the source data (de-identified or anonymised microdata) on which the statistics are based, for researchers and public authorities for the purposes of preparing statistical results and analyses. Access can be granted upon application and subject to conditions. Refer to the details about this at Access to data from Statistics Norway.
The Index of Industrial Production is part of a system of short-term statistics compiled to monitor the economy. The primary goal of the Index of Industrial Production is to monitor the development of added value (production minus intermediate consumption) in the industries covered. However, this is quite difficult on a monthly basis, so the index maps out the development of production in oil and gas extraction, mining and quarrying, manufacturing and electricity and gas supply. No calculations are made for the intermediate consumption, which it is assumed develops in the same manner as the production. The survey is financed exclusively by government appropriations.
As from January 2009 all results will refer to Standard Industrial Classification 2007 (SIC2007) . The historical series are recalculated according to this version of SIC, and results dating back to 1995 and 1990 (totals) are available in the Statbank database.
The Index of Industrial Production is used in the quarterly national accounts in Statistics Norway to help calculate the gross domestic product. Preliminary figures for 2020 show that added value from the activity covered was approximately 22 per cent of the gross domestic product. It is also an important input to prognoses on the industrial production carried out by other authorities and organisations in Norway.
No external users have access to the statistics and analyses before they are published and accessible simultaneously for all users on ssb.no at 8 am. Prior to this, a minimum of three months' advance notice is given in the Statistics Release Calendar. This is one of Statistics Norway’s key principles for ensuring that all users are treated equally.
The Index of Industrial Production is a leading indicator of future production of oil and gas extraction, mining and quarrying, manufacturing, electricity and gas supply, and is one of several indicators that monitor the performance of the economy. The correlation with :
- Statistics on turnover
- Quarterly Investment Statistics Manufacturing, Mining and Quarrying and Electricity Supply
- Economic trends for Norway and abroad
- Industrial statistics. Structural data
- Quarterly national accounts
- External merchandise trade
- Electricity
is utilised for control purposes. The Statistics on turnover for Oil and gas extraction, mining and quarrying, manufacturing, electricity and gas supply and the Production Volume Index have joint data collection.
The statistics are developed, produced and disseminated pursuant to Act no. 32 of 21 June 2019 relating to official statistics and Statistics Norway (the Statistics Act).
Regulation (EU) 2019/2152 of the European Parliament and of the Council of 27 November 2019 on European business statistics (EBS)
The population covers all establishments in mining and quarrying (SIC 05, SIC 07-08, SIC 09.9), oil and gas extraction (SIC 06, SIC 09.1), manufacturing (SIC 10-33) and electricity and gas supply (SIC 35), see Standard Industrial Classification 2007 (SIC2007) . The Central Register of Establishments and Enterprises defines the population, and the establishment is the observation unit in the survey. (See Definitions for a complete definition of establishment and enterprise.)
The survey uses production data collected by online questionnaires from the units included in the sample. Monthly production figures on oil and gas extraction in Norway are transmitted electronically by the Norwegian Offshore Directorate. Production figures for electricity supply from water resources are provided by EL HUb and Statistics Norway's electricity statistics.
The sample includes about 1 720 establishments (2020), which includes all establishments with 100 employees or more, or with a turnover of at least 10 per cent of the publishing level. The remaining units are drawn based on stratification and optimal allocation, proportional to the size of the unit measured by the number of employees. The sample does not include establishments with less than ten employees. In addition, the whole population within electricity, gas and steam as well as within extraction of crude petroleum and natural gas is covered.
The survey is based on data collected by questionnaires. The questionnaires are returned electronically via Altinn. The questionnaire is made available on Internet at the end of the relevant month. The deadline for answering the questionnaire is normally the 15th of the following month. Establishments are notified by SMS or e-mail when the questionnaire is available in Altinn. The establishment's local office fills in the questionnaire. Establishments that fail to return the questionnaire receive a compulsory fine within a week of the deadline, whereupon a new deadline of seven days is set.
The questionnaires are downloaded from Altinn, and the data are automatically checked for duplicates. Where there are significant deviations, the establishment is contacted. In cases of extreme deviations, further editing is carried out. Editing is defined here as checking, examining and amending data. Comparisons with the annual industrial statistics are also carried out.
First stage of index compilation
Estimated production values in fixed prices are calculated for the observation units. For the first stage, the indices at group or processing level are estimated by summing up these production values. The values of the reference period are then set in relation to the value of period t-1. The values of period t-1 are estimated average production values from the previous year. This provides the short-term index for the current month.
(1)
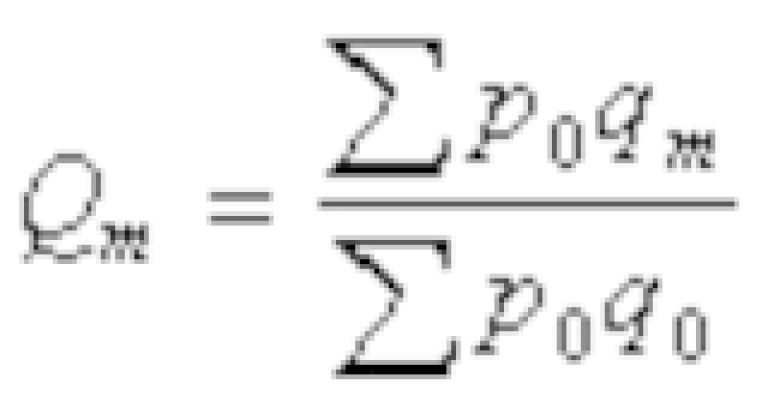
Qm = short term index of production value in fixed prices for month m
p0 = price in the previous year
qm = quantity in reference period
q0 = average monthly quantity in the previous year
The prices in the calculation of the short-term index are derived from statistics of external trade in goods, indicies of volume and price as well as the producer price index of oil and gas, manufacturing, mining and electricity in Norway. Some prices are also collected directly from the relevant enterprises in Norway, if not available in the statistics stated above. The prices are updated yearly.
Production is measured using two types of indicators - reflecting (more or less) the change in gross production/turnover. The indicators are physical output and hours worked. The production is measured by physical output in the following industries (SIC 2007: 05-08, 10-12, 16-17, 19-24, 27.3, 27.5, 31, 32 (ex. 32.5) and 35)). The calculations follow a set of identical observation units over a period of 2 years and an activity classification (SIC 2007). No adjustments are made for quality changes in the relevant products over time.
The production is measured by hours worked in the engineering industries (SIC 2007: 25-27 (ex. 27.3 and 27.5), 28-30, 32.5 and 33) and in publishing and printing (SIC 2007: 18). The production is also measured by hours worked in support activities for petroleum and natural gas extraction (SIC 2007: 09.1) from 2010 and in manufacturing of textiles, wearing apparel and leather and related products (SIC 2007: 13-15) from 2011.
New projects in industries with hours worked as indicator are intercepted as they start up, as long as the project is carried out by establishments covered by the sample. It is the total number of hours carried out in the survey period that are reported, independent of which project the hours are used on.
Numbers of hours worked from contracted workers are collected from 2011. Numbers of hours worked from contracted workers are included in the calculation of the index of production from 2012.
Numbers of hours worked from the officials are collected from 2014. As of 2015 these are included in the reporting and the calculations.
Change in productivity from year to year is taken into account, by fixed factors, when using the work input as basic information for compiling the index. The use of this type of indicator implies that output changes proportionally with input.
These factors are updated in 2020 and are based on numbers from Annual final national accounts . Value added per hour worked in basic value, annual change in volume in per cent from the last 5 years are used.
Second stage of index compilation: Index of Industrial Production at higher aggregation levels
Production indices for the industries at the 4-digit level can be aggregated according to the hierarchical structure of NACE Rev. 1 to indices at higher levels and also to main industrial groupings (See Defenitions). The share of added value of each class in the base year is used for the calculation of the aggregates. Last available value added from structural data are forcasted to base year by numbers from quarterly national accounts. In the case of a chain index, such as the Production Volume Index, the weights are updated annually.
(2)
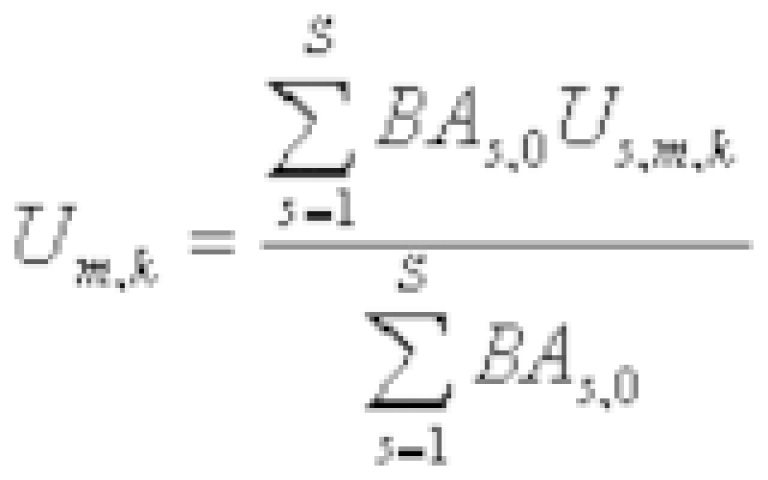
Um,k = unadjusted short-term index aggregated over the underlying sectors, month m
BAs,0 = added value at factor cost, sector s, weight-year (t-1)
Us,m,k = unadjusted short-term index of sector k and month m
The calculation applies a Lays Peres formula.
Chaining to long-term indices:
Unadjusted short-term indices will be chained to the long-term index (base 2021) at various levels. This must be done because the bases of the short-term indices and the weights change once a year, and to evaluate the results of the index calculation over time. Chaining to the long-term indices is done using the following formula:
(3)
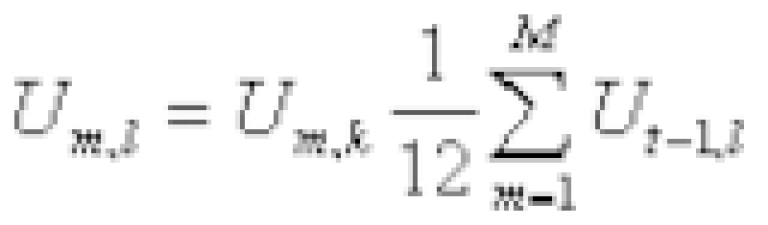
where
Um,k = short-term index, unadjusted, month m
Um,l = long-term index, unadjusted, month m
Ut-1,l = long-term indices, unadjusted, average last year
The production output will normally vary from month to month in several industries due to factors such as the length of the month, number of working days and holidays such as Easter. Pre-adjusted series are calculated and published in order to deal with some of these effects (Calender adjusted series).
Since the effect due to the length of month is the same every year, it should not be included in the calender component, but in the seasonal component and be disregarded in the calender adjustments. This has been done from 2007.
Monthly time series are often characterised by considerable seasonal variations, which might complicate their interpretation. Seasonal effects are therefore corrected for and seasonally adjusted figures are published.
For more details about seasonal adjustment of the Index of industrial Production, see the separate tab " About seasonal adjustment".
Confidential micro data: According to § 2-8 of the Statistics Act, collected data are subject to confidentiality and are to be kept or destroyed in a secure manner. Any use of the data must be in accordance with the rules set out by the Data Inspectorate.
Time series that are not to be published: The publication of data is subject to the provisions of § 2-7 of the Statistics Act. Statistics Norway does not publish figures if there is a risk of the respondent’s contribution being identified. This means that, as a general rule, figures are not published if fewer than three units form the basis of a cell in a table or if the contribution of one or two respondents constitutes a very large part of the cell total. Statistics Norway can make exceptions to the general rule if deemed necessary to meet the requirements of the EEA agreement, if the respondent is a public authority, if the respondent has consented to this, or when the information disclosed is openly accessible to the public.
More information can be found on Statistics Norway’s website under Methods in official statistics, in the ‘Confidentiality’ section.
Unpublished data: Edited data that are not published are subject to confidentiality. This implies that they are unavailable to users without explicit approval. Such agreements only apply to internal users.
Historical series classified according to SIC2007 and dating back to 1990 and 1995 are available.
Users must ensure that they use the same version of SIC when making comparision over time. As from January 2009 SIC 2002 is replaced by SIC 2007.
Finished historical series classified according to SIC2002 and dating from 1986 to 2008 are also available in StatBank Norway.
Measurement errors are caused by the questionnaire or the respondent’s internal system for obtaining the data. Examples are ambiguous questions, misunderstood questions or erroneous data from the respondents. In the Production Volume Index, errors in reported figures may originate from misunderstandings of the concept of production or the definition of the main variables used in the survey. Unambiguous guidelines and definitions are therefore emphasised.
Processing errors may occur when Statistics Norway processes the data. However, data from electronic questionnaires are loaded directly into the system. Considerable deviations from previous periods will normally become evident during the editing of the data.
Errors of non-response refer to errors that either occurs due to missing questionnaires or empty boxes in the questionnaire. The response rate after the deadline has expired is around 95 per cent. Critical units, i.e. units that have a considerable impact on the results on a detailed level aggregation (2-digit NACE), are contacted by telephone. Missing questionnaires or empty boxes in the questionnaires are mainly imputed automatically, based on previous reported figures (cold-deck method). No calculations of non-response errors have been made.
Sampling errors refer to uncertainties that occur in sample surveys as opposed to full counts. The sample variance equals the expected deviation between a sample survey and a full count. The Production Volume Index covers about 80 per cent of the turnover in the population (2016). In order to ensure a high degree of relevance at the lowest cost possible, great effort is put into including all large units in the population in the sample. No calculations of the sampling errors for the survey have been conducted. The survey will normally try to correct for major new enterprises in the population by routine checks.
Coverage errors refer to errors in registers that define the population, in this case the Central Register of Establishments and Enterprises. As a result of such errors, units may be incorrectly included in or excluded from the population. Other problems are related to delays in the update of the registers and units that are incorrectly classified. From experience, a limited share of the population units is incorrectly classified. This is usually due to misleading or insufficient information at a certain time. No calculations on the size and significance of such errors have been carried out. However, such errors are not considered to be greater than for other quantitative short-term statistics.
Modelling errors are mainly related to problems with the seasonal adjustment of time series. Such problems are caused by deviation from the conditions that form the basis for the model used. Typical problems are related to movable public holidays such as Christmas and Easter. X12-ARIMA generates a number of indicators that are used to evaluate the quality of the seasonal adjustment. These indicators have identified a stable seasonal pattern.
A revision is a planned change to figures that have already been published, for example when releasing final figures as a follow-up to published preliminary figures. See also Statistics Norway’s principles for revisions.
Revisions in previously published seasonally adjusted figures can take place when new observations (or revised previous observations) are included in the basis of calculation. The scope of the revision is usually greatest in the most relevant part (last 1–2 years) of seasonally adjusted time series. A corresponding revision in trends is also typical, particularly at the end of the time series. The extent of the revision of trends and seasonally adjusted figures is partly determined by the revision policy, see Section 4 of the European Statistical System (ESS) Guidelines on Seasonal Adjustment on the Eurostat website. For more information on the revision of seasonally adjusted figures, see the ‘About seasonal adjustment’ section in the relevant statistics.
Monthly time series are often characterised by considerable seasonal variations, which might complicate their interpretation. Such time series are therefore subjected to a process of seasonal adjustment in order to remove the effects of these seasonal fluctuations. Once data have been adjusted for seasonal effects by X-12-ARIMA or some other seasonal adjustment tool, a clearer picture of the time series and the changes in the time series emerges.
For more information on seasonal adjustment: metadata on methods: seasonal adjustment .
Seasonally adjusted series
For the index of industrial production seasonal adjusted series for 32 industry aggregates are published. This is the overall index, sections, divisions and groups according to the structure of SIC 2007 as well as indexes classified according to EUROSTAT’s end-use categories (Main Industrial groupings MIG’s).
The index of industrial production is a part of a system of short-term statistics complied to monitor the economy. The primary goal of the survey is to monitor the level and development in the volume of production in oil and gas extraction, mining and quarrying, manufacturing and electricity and gas supply.
The output in the industrial production will normally vary from month to month because of public holidays and vacations in July and December and other things. The main aim of seasonal adjustment is to remove changes that are due to seasonal or calendar influences to better be able to compare the output in the industrial production from month to month.
Pre-treatment routines/schemes
Pre-treatment is an adjustment for variations caused by calendar effects and outliers.
Running a detailed pre-treatment. This means using models which are specially adapted for the pre-treatment of the raw data for a given serie.
Calendar adjustment
Calendar adjustment involves adjusting for the effects of working days/trading days and for moving holidays. Working days/trading days are adjustment for both the number of working days/trading days and for that the composition of days can vary from one month to another.
Calendar adjustments are done on all series showing significant and plausible calendar effects within a statistically robust approach, such as regression or RegARIMA (a regression model with an ARIMA structure for the residuals). The regression variables for the calendar adjustment are adapted to reflect the working days, public holidays and so forth specific to Norway.
Methods for trading/working day adjustment
RegARIMA correction is used – in this case, the effect of trading days is estimated in a RegArima framework. The effect of trading days can be estimated by using a correction for the length of the month or leap year, regressing the series on the number of working days, etc. In this case, the residuals will have an ARIMA structure.
Correction for moving holidays
Correction based on an estimation of the duration of the moving holidays effects, specifically adjusted to Norwegian circumstances is used.
National and EU/euro area calendars
Use of the Norwegian calendar or the EU/euro area calendar as appropriate; the EU/euro area calendar is based on the mean number of working days in the different member states.
For seasonal adjustment of the index of industrial production the Norwegian calendar is in use.
Improved routine from 2009: The new routine takes into account the Norwegian calendar and thereby improving the quality of the seasonally adjusted results. The change has been applied from the January 2009 publishing, and concerns the pre-treatment method (calendar adjustment). The old method adjusted for working-days and for moving holidays (Easter, Pentecost, Ascension Day), leap year and outliers. The new method also adjusts for fixed Norwegian public holidays (1. January, 1. and 17. May) and for the Christmas holiday (24. - 26. December).
Treatment of outliers
Outliers, or extreme values, are abnormal values of the series.
Outliers are detected automatically by the seasonal adjustment tool. The outliers are removed before seasonal adjustment is carried out, and then reintroduced into the seasonally adjusted data.
Model selection
Pre-treatment requires choosing an ARIMA model, as well as deciding whether the data should be log-transformed or not.
Model selection is primarily automatic, but in some cases models are selected manually.
Log transformation of the unadjusted figures is carried out.
Decomposition scheme
The decomposition scheme specifies how the various components – basically trend-cycle, seasonal and irregular – combine to form the original series. The most frequently used decomposition schemes are the multiplicative, additive or log additive.
Manual decomposition scheme selection after graphical inspection of the series.
For series with zero or negative values, adding a constant to make the series positive and select the appropriate decomposition scheme.
For decomposition of the index of industrial production the log additiv method is in use.
Choice of seasonal adjustment approach
X-12-ARIMA
Consistency between raw and seasonally adjusted data
In some series, consistency between raw and seasonally adjusted series is imposed.
For the index of industrial production, no constraints are applied.
Consistency between aggregate/definition of seasonally adjusted data
In some series, consistency between seasonally adjusted totals and the aggregate is imposed. For some series there is also a special relationship between the different series, e.g. GDP which equals production minus intermediate consumption.
Only equality between the overall index and extraction and related services, manufacturing, mining and quarrying, and electricity, gas and steam is imposed.
Direct versus indirect approach
Direct seasonal adjustment is performed if all time series, including aggregates, are seasonally adjusted on an individual basis. Indirect seasonal adjustment is performed if the seasonally adjusted estimate for a time series is derived by combining the estimates for two or more directly adjusted series.
Direct approach is used. The raw data are aggregated and the aggregates and components are then directly seasonally adjusted using the same approach and software. Any discrepancies across the aggregation structure are not removed.
The overall index is a formula of extraction and related services, mining and quarrying, manufacturing and electricity, gas and steam supply.
Horizon for estimating the model and the correction factors
When performing seasonal adjustment of a time series, it is possible to choose the period to be used in estimating the model and the correction factors. Correction factors are the factors used in the pre-treatment and seasonal adjustment of the series.
The whole time series is used to estimate the model and the correction factors.
General revision policy
Seasonally adjusted data may change due to a revision of the unadjusted (raw) data or the addition of new data. Such changes are called revisions, and there are several ways to deal with the problem of revisions when publishing the seasonally adjusted statistics.
Seasonally adjusted data are revised between two consecutive official releases of the release calendar. The unadjusted (raw) data are not normally revised.
Concurrent versus current adjustment
The model, filters, outliers and regression parameters are re-identified and re-estimated continuously as new or revised data become available.
Horizon for published revisions
The revision period for the seasonally adjusted results is limited to 3-4 years (preferably 4) prior to the revision period of the unadjusted data, while older data are frozen.
Comments : Seasonally adjusted numbers are updated from 2010.
Evaluation of seasonally adjustment data
Continuous/periodical evaluation using standard measures proposed by different seasonal adjustment tools.
Quality measures for seasonal adjustment
Additional specific tests are computed to complement the set of available diagnostics within the seasonal adjustment tool.
A table containing selected quality indicators for the seasonal adjustements is available. The table covers the published industry aggregates for the volume of production. The table is available here; Indicators of quality in seasonal adjusted figures.
For more information on the quality indicator in the table see: metadata on methods: seasonal adjustment.
Seasonal adjustment of short time series
All series are sufficiently long to perform an optimal seasonal adjustment.
Treatment of problematic series
Problematic series are treated in a special way only when they are relevant. The remaining series are treated according to normal procedures.
Comments : Only problematic series with huge inconsistencies will be treated in a special way.
Data availability
Unadjusted figures (orignial series or raw data), calendar adjusted, seasonally adjusted and smoothed seasonally adjusted figures are available.
Press releases
In addition to the unadjusted figures (raw data), the following series are released: calendar adjusted, seasonally adjusted and smoothed seasonally adjusted figures.
Both levels/indices and different forms of growth rates are presented.

Contact
Produksjon og omsetning