Content
Published:
This is an archived release.
Lower electoral turn out among immigrants
Approximately 52 per cent of the immigrant population participated in the Storting Election on the 10th of September. Roughly 94 000 persons with immigrant background were eligible to vote. The electoral turn out for the entire population was 75 per cent.
Persons with non-western background had a lower turn out than those with western background. Age is probably a crucial factor in explaining the low turn out.
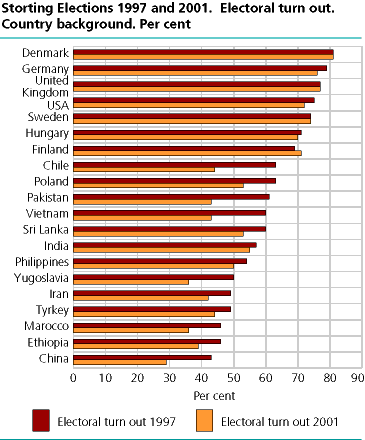
Among those with western background the turn out was 75 per cent, for those with non-western background the turn out was 45 per cent. The electoral turn out for the Pakistani and the Vietnamese, the two largest immigrant groups, was 43 per cent.
Compared with an equivalent survey in 1997, the electoral turn out has decreased with 11 percentage points in the immigrant population, most for the youngest age groups.
Age distribution an important explanation
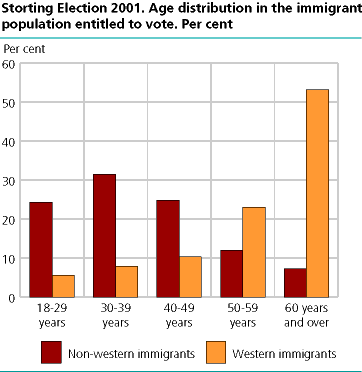
Two demographic features partly explain the lower turn out in the immigrant population. Firstly, in 1997, 1/3 of the immigrant population entitled to vote had western background; in 2001 this share had decreased to 1/5. Earlier surveys have shown that immigrants with western background have had a higher electoral turn out than those with non-western background.
This is reinforced by an uneven age distribution in the two groups. Among those with non-western background the age distribution is fairly even, while among those with western background there is a predominance of older people. Other surveys show that voting is correlated with age, and that young people tend to vote in a lesser degree than older people.
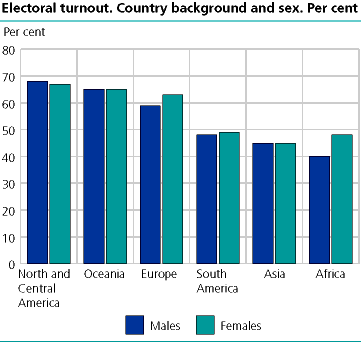
Women with higher turn out than men
The survey indicates that women voted in a higher degree than men, 54 per cent of the women in the sample used their right to vote, whereas 49 per cent of the men voted. There are however, considerable differences when we examine country backgrounds.
The survey is based on a census list prepared for the Storting Election 2001. The population; those entitled to vote among the immigrant population, numbered approximately 94 000 persons. A stratified sample of 7 500 persons was drawn. The Ministry of Local Government and Regional Development has commissioned the survey.
Tables:
- Table 1 Storting Election 2001. Electoral turn out in per cent among the sample of Norwegian citizens with immigrant background. By country background and sex.
- Table 2 Storting Election 2001. Electoral turn out in per cent among the sample of Norwegian citizens with immigrant background. By age and sex
- Table 3 Storting Election 2001. Electoral turn out in per cent among the sample of Norwegian citizens with immigrant background. By years of residence and sex
- Table 4 Storting Election 2001. Electoral turn out in per cent among the sample of Norwegian citizens with immigrant background. By country background and years of residence.
- Table 5 Storting Election 2001. Electoral turn out in per cent among the sample of Norwegian citizens with immigrant background. By county and sex
- Table 6 Storting Election 1997 and 2001. Electoral turn out in per cent among the sample of Norwegian citizens with immigrant background. By country background. Change in percentage points
- Table 7 Storting Election 2001. Electoral turn out in per cent among the sample of Norwegian citizens with immigrant background. By country background and age.
The statistics is now published as Electoral turnout.
Contact
-
Statistics Norway's Information Centre
E-mail: informasjon@ssb.no
tel.: (+47) 21 09 46 42