Content
Published:
This is an archived release.
Half of the immigrants voted
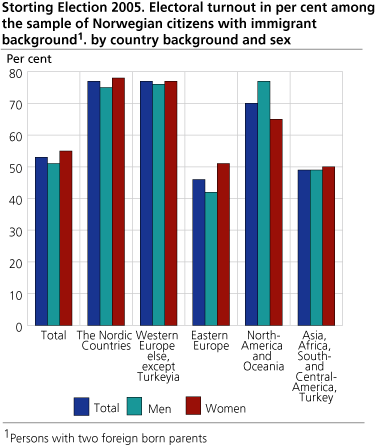
Approximately 53 per cent of the immigrant population participated in the Storting Election last year, slightly more than four years ago. The electoral turn out for the entire population was 77.4 percent.
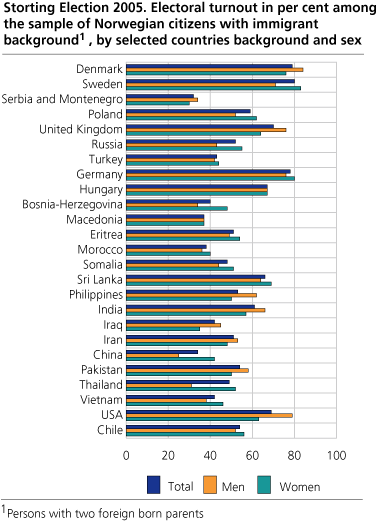
Compared with an equivalent survey in 2001, the electoral turn-out has decreased with 1 percentage point in the immigrant population. Among immigrants with western background the turn-out was 76 per cent, while 49 per cent of those with non-western background voted. The electoral turn-out for the Pakistanis, one of the largest immigrant groups, increased with 11 percentage points, from 43 to 54 per cent.
Women with higher turn-out than men
The survey indicates that women voted in a higher degree than men. 55 per cent of the women in the sample used their right to vote, whereas 51 per cent of the men voted. Women from Europe, Africa and Oceania have a higher electoral turnout than men from the same areas. For the whole group of western immigrants there is no difference in electoral turnout and sex. There are however, considerable differences when we examine country backgrounds.
Still increasing numbers with non-western background
To better understand why the immigrant population differ from the entire population in electoral turnout, it is necessary to look upon the composing, and especially the age distribution. In 1997, 1/3 of the immigrant population entitled to vote had western background, in 2001 this share had decreased to 1/5 and in 2005 the portion has sunk to 15 per cent In other words, 85 per cent of the persons entitled to vote in the immigrant population have non-western background. The age distributions in the two groups are also different. In the group of western immigrants, more than 60 per cent are older than 60 years and only 2 per cent are in the youngest group. Among non-western immigrants only 8 per cent are older than 60 years. 18 per cent in this group are in the age group 18-25 years. It is a well known fact that electoral turnout increase with age. Other surveys show that voting is correlated with age, and that young people tend to vote in a lesser degree than older people.
|
The survey is based on a census list prepared for the Storting Election 2005. The population; those entitled to vote among the immigrant population, numbered approximately 122 000 persons. A stratified sample of 6 800 persons was drawn. The Ministry of Local Government and Regional Development has commissioned the survey. |
See also: Storting Election 2005
Tables:
- Table 1 Storting Election 2005. Electoral turnout in per cent among the sample of Norwegian citizens with immigrant background, by country background and sex
- Table 2 Storting Election 2005. Electoral turnout in per cent among the sample of Norwegian citizens with immigrant background, by age and sex
- Table 3 Storting Election 2005. Electoral turnout in per cent among the sample of Norwegian citizens with immigrant background, by years of residence and sex
- Table 4 Storting Election 2005. Electoral turnout in per cent among the sample of Norwegian citizens with immigrant background, by country background and years of residence
- Table 5 Storting Election 2005. Electoral turnout in per cent among the sample of Norwegian citizens with immigrant background, by county and sex
- Table 6 Storting Election 2005. Electoral turnout in per cent among the sample of Norwegian citizens with immigrant background, by country background and age
Tables
Contact
-
Tove Bergseteren
E-mail: tove.bergseteren@ssb.no
tel.: (+47) 99 79 08 19
-
Statistics Norway's Information Centre
E-mail: informasjon@ssb.no
tel.: (+47) 21 09 46 42


