Content
Published:
This is an archived release.
More women complete higher education degrees
In the ten years from 1995 to 2005 twice as many women completed a higher education degree than in the ten years from 1985 to 1995. The corresponding figure for men was 42 per cent.
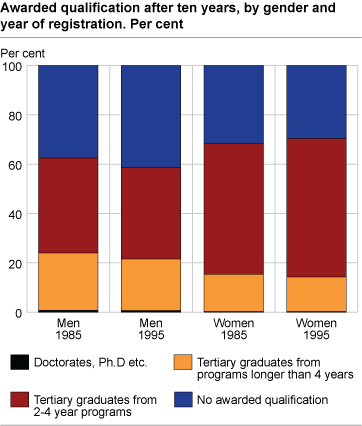
At all levels in tertiary education the rise in completed degrees was higher for women than for men. Among students who began their studies in 1985, 6 900 men and 7 700 women graduated within ten years. In comparison, the number of female graduates was 102 per cent higher among those who registered as students in 1995. The number of degrees completed by men was 42 per cent higher in the period 1995 to 2005 than in the period 1985 to 1995.
Most men among those who achieve a Ph. D
More men than women completed a Ph. D degree in the last period. Among those who were new students in 1995, 115 men and 61 women completed a Ph. D during the next ten years. 56 per cent of the women who completed a degree in this period, graduated with an undergraduate degree, while only 14 per cent completed a postgraduate degree. The percentage of men completing a postgraduate degree was 21. Men accounted for the highest percentage of those who did not complete a degree in this period. 41 per cent of the male students who were first registered as students in 1995 did not complete a degree within the next ten years, while the same figure for women was 30 per cent.
Higher throughput
For some undergraduate studies which can be taken at universities and specialised university colleges,
the proportion who completed an undergraduate degree within the expected timeframe was 30 per cent between 1995 and 2005 and 24 per cent between 1985 and 1995.
|
Throughput statistics are based on the number of years since the first registration in tertiary education, and are not readjusted if a student changes to a new degree. Therefore, according to this definition, very few students who swap degrees underway will be able finish within the expected timeframe. Deferment and part-time studies are not accounted for either. |
|
As part of the 2003 Quality Reform, undergraduate programmes were reduced from four to three years and postgraduate programmes from six to five years. One of the objectives of the reform was to align Norwegian tertiary education with international Bachelor and Master programmes. The throughput statistics are affected by the transition from old to new degree structures, as students may have started a four or six-year degree and changed to a Bachelor or Master degree underway. |
Tables:
- Table 1 Undergraduate courses, by number of graduates in the 2005/2006 study year and number of years since the student was first registered in tertiary education. Absolute figures and per cent
- Table 2 Postgraduate courses, by number of graduates in the 20052 since the student was first registered in tertiary education. Absolute figures and per cent
- Table 3 New entrants to tertiary education in 1985 and 1995, by gender and awarded qualification after ten years. Absolute figures and per cent
- Table 4 New entrants to tertiary education in 1985 and 1995, by parents' level of education and awarded qualification after 10 years. Absolute figures and per cent
- Table 5 Completion of selected undergraduate courses in the 20051. Absolute figures and per cent
Contact
-
Jane Bekkengen
E-mail: jane.hansine.bekkengen@ssb.no
tel.: (+47) 40 81 13 52
-
Geir Nygård
E-mail: geir.nygard@ssb.no
tel.: (+47) 48 15 13 44
-
Nawid Fazli
E-mail: nawid.fazli@ssb.no
tel.: (+47) 97 09 77 18

