Content
Published:
This is an archived release.
Marginal increase in revenue from environmental taxes
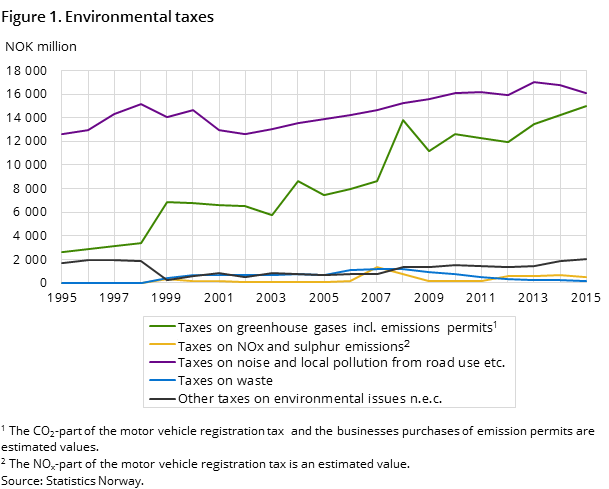
In 2015, almost NOK 33.8 billion was paid in environmental taxes in Norway. This is an increase of NOK 50 million, or 0.15 per cent, from the previous year. Taxes on greenhouse gas emissions increased, while taxes on fuel decreased.
| 2014 | 2015 | Change in per cent | ||
|---|---|---|---|---|
| 2014 - 2015 | 2000 - 2015 | |||
| Environmental taxes, total | 33 742 | 33 792 | 0.1 | 48.6 |
| Taxes on greenhouse gases incl. emissions permits, total | 14 220 | 14 972 | 5.3 | 121.2 |
| Taxes on NOx and sulphur emissions, total | 691 | 487 | -29.5 | 316.2 |
| Taxes on noise and local pollution from road use etc., total | 16 723 | 16 081 | -3.8 | 9.8 |
| Taxes on waste, total | 232 | 190 | -18.1 | -71.2 |
| Other taxes on environmental issues n.e.c., total | 1 876 | 2 062 | 9.9 | 275.6 |


Environmental taxes are dominated by taxes on greenhouse gas emissions and taxes on road use. Of the NOK 33.8 billion that was paid in environmental taxes, taxes on greenhouse gas emissions accounted for 44 per cent, while taxes on road use amounted to 48 per cent.
In 2015, the environmental taxes share of total taxes was 3.8 per cent. This is an increase of 0.1 percentage point from 2014.
Increased revenue from taxes on greenhouse gas emissions
The total taxes on greenhouse gas emissions increased in 2015. The increase of 5.3 per cent corresponded to NOK 752 million, and was attributed to an increase in revenue from the tax on CO2 emissions, the tax on CO2 emissions in the petroleum sector and the imputed tax on emission permits. In total, these taxes increased by NOK 1 391 million. The CO2 component in the motor vehicle registration tax counteracted this increase with a decrease of 18.3 per cent, which amounts to NOK 692 million.
Drop in revenue from diesel tax
The total taxes on road use decreased by 3.8 per cent in 2015, which corresponds to a fall of NOK 642 million. This fall continued the decrease from 2013-2014 of 1.8 per cent. The petrol tax and the diesel tax dominate the taxes on road use. The petrol tax fell by 5 per cent in 2015, and now constitutes 36 per cent of the total taxes on road use. Revenue from the diesel tax increased in the period 2002 to 2014, but fell 3.3 per cent in 2015.
Revenue from tax on mineral oils continues to rise
Government revenue from tax on mineral oils increased by 10.1 per cent in 2015. This was a smaller increase than the increase of 31 per cent the previous year. The increase in 2014 was due to an increase in the tax rates, while the tax rates for 2015 were only moderately adjusted. The tax on mineral oils now makes up 5.9 per cent of the total environmental taxes.
Figures for 2014 are updated and more detailed
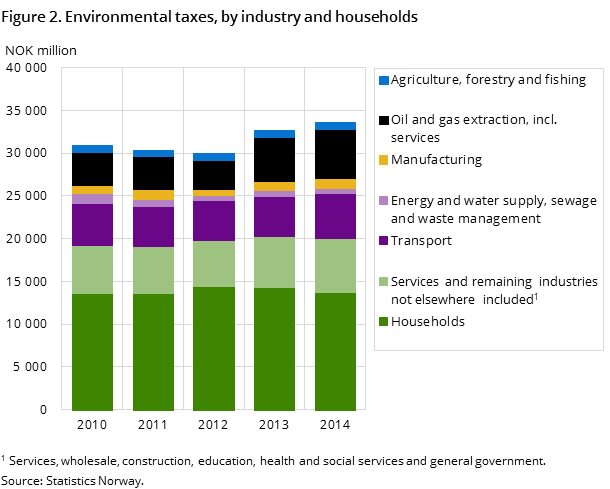
In relation to this release of figures for 2015, the figures for 2014 are updated. Total environmental taxes for 2014 are adjusted upwards by 0.12 per cent compared with the figures that were presented as preliminary figures for 2014. Figures for 2014, which amount to NOK 33.7 billion, are now to be regarded as final figures and are distributed by industries and households.
Increase in industry’s share of environmental taxes
Industry paid NOK 20.0 billion in environmental taxes in 2014. This amounts to 59.1 per cent of the total environmental taxes. Costs to industry of environmental taxes increased by 8.5 per cent in the period 2013-2014. Households paid the remaining NOK 13.8 billion of environmental taxes in 2014. This was a decrease of 4.2 per cent from the year before.
The distribution of total environmental taxes between households and industry changed in the period 2012-2014. Households paid a higher share in 2012 (48.1 per cent) than in 2014 (40.9 per cent). Most of the taxes paid by the households were on fuel, followed by greenhouse gas emissions, while the taxes paid by industry were mainly on greenhouse gas emissions, followed by taxes on fuel.
Extraction and transport industries pay the most
Together with the transport industries, the quarrying and extraction industries pay most of industry’s environmental taxes. In 2014, these industries paid 28 and 26 per cent respectively. These industries also experienced the largest increase in environmental taxes from 2013 to 2014 compared to other industries.
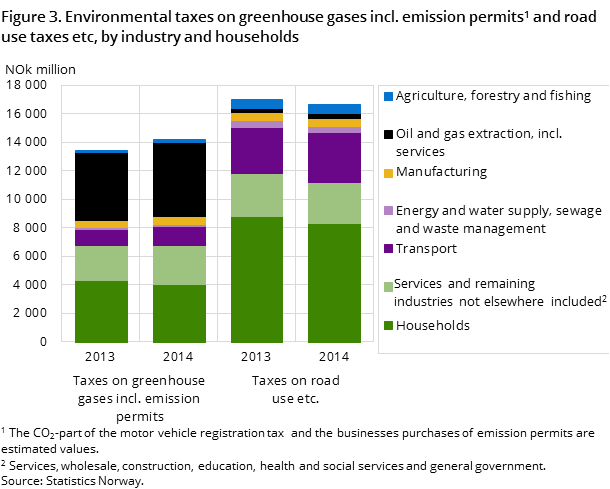
The quarrying and extraction industries paid over one third of the taxes on greenhouse gas emissions, while the transport industries paid about 20 per cent of the road use taxes in 2014.
Changes in figuresOpen and readClose
A new method was introduced in the 2014 figures for calculating the CO2 and NOX component in the motor vehicle registration tax. This method uses actual collected tax on first time registered vehicles, while the previous method calculated the components based on information on the qualities of the vehicles and the tax rates.
The figures showing the environmental taxes by industry were corrected for all years. The main correction was in the distribution of taxes between households and the transport industry, which resulted in a decrease of 2-3 per cent of total environmental taxes for the households.
The figures for 2013 were corrected.
Environmental economic instrumentsOpen and readClose
The statistics on environmental economic instruments give an overview of taxes introduced to correct for negative effects in the environment caused by human activities, in other words making environmental damage more expensive.
Examples of environmental taxes included are taxes on greenhouse gases incl. emissions permits, taxes on NOX and sulphur emissions, taxes on noise and local pollution from road use etc. and taxes on waste. The taxes are distributed by industries and households in order to show who pays the taxes.
Other figures are used for international reportingOpen and readClose
The definition of environmentally related taxes applied in the international reporting differs from that used for environmental taxes. The difference from total environmental taxes is mainly due to the electricity tax, the annual tax on motor vehicles, the re-registration tax and the motor vehicle registration tax, with the exception of the CO2 and NOX component. This definition is primarily chosen in order to enable international comparisons.
The international reporting includes several individual taxes and is divided into categories other than for environmental taxes.
Contact
-
Eivind Langdal
E-mail: eivind.langdal@ssb.no
tel.: (+47) 47 76 98 77
-
Ingrid Semb Weyer
E-mail: ingrid.semb.weyer@ssb.no
tel.: (+47) 40 90 23 51
-
Trine Heill Braathu Randen
E-mail: trine.heill.braathu.randen@ssb.no
tel.: (+47) 91 10 67 45
-
Martin Lundeby Grimstad
E-mail: martin.grimstad@ssb.no
tel.: (+47) 90 66 47 43
