Content
Published:
This is an archived release.
Industrial structure crucial for county distribution
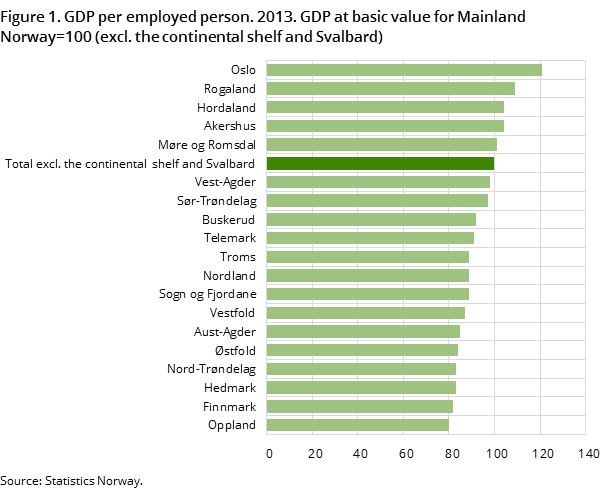
Value added per employed person was highest in Oslo and Rogaland in 2013. Akershus, Hordaland and Møre og Romsdal were also above the national average.
| 2013 | |||
|---|---|---|---|
| GDP per employed persons, index | GDP per inhabitant, index | Household's disposable income per inhabitant, index | |
| Total | 100 | 100 | 100 |
| Østfold | 84 | 68 | 92 |
| Akershus | 104 | 93 | 107 |
| Oslo | 121 | 173 | 110 |
| Hedmark | 83 | 72 | 92 |
| Oppland | 80 | 71 | 94 |
| Buskerud | 92 | 83 | 99 |
| Vestfold | 87 | 74 | 96 |
| Telemark | 91 | 77 | 94 |
| Aust-Agder | 85 | 71 | 93 |
| Vest-Agder | 98 | 92 | 93 |
| Rogaland | 109 | 117 | 106 |
| Hordaland | 104 | 107 | 102 |
| Sogn og Fjordane | 89 | 89 | 96 |
| Møre og Romsdal | 101 | 99 | 98 |
| Sør-Trøndelag | 97 | 96 | 99 |
| Nord-Trøndelag | 83 | 73 | 92 |
| Nordland | 89 | 83 | 95 |
| Troms Romsa | 89 | 88 | 98 |
| Finnmark Finnmárku | 82 | 82 | 96 |


Value added per employed person in Oslo was 21 per cent above the average for Mainland Norway. This is because of the industrial structure in Oslo: industries with above average value added per employed person are also heavily represented in the capital city.
Rogaland was 9 per cent above the national average. This is due to contributions from oil-related activity. These industries had high levels of value added per employed person in 2013.
Akershus and Hordaland had 4 per cent higher value added per employed person than the national average. These counties have similar industries to the capital. In Hordaland, we also see contributions from electricity production, oil-related activities and fishing and aquaculture. Møre og Romsdal is slightly above average, which is partly due to the manufacturing industries.
The lowest value added per employed person was found in Oppland, Finnmark, Hedmark and Nord-Trøndelag. These counties were between 17 and 20 per cent below the national average.
These counties all have relatively high proportions of government services. General government accounted for over 30 per cent of the counties’ value added. In comparison, for the country as a whole, general government constituted about a quarter of total value added.
Value added in general government is conventionally calculated without including return to capital, which is included in market output. This means that the value added per employed person in general government will be lower than, for example, in private services.
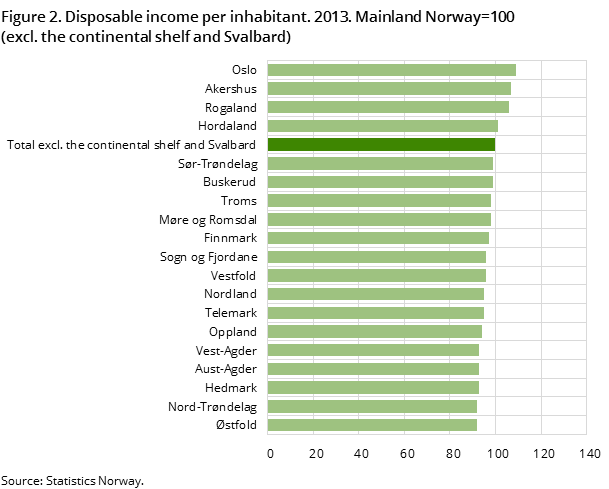
As is the case with value added per employed person, Oslo had the highest disposable income per capita. The capital city was 10 per cent above the national average, and disposable income per capita was almost NOK 258 000.
Contact
-
Edita Zahirovic
E-mail: edita.zahirovic@ssb.no
tel.: (+47) 40 90 26 12
-
Julian Paulsen Blytt
E-mail: julian.blytt@ssb.no
tel.: (+47) 40 90 23 26
