Content
Published:
This is an archived release.
Oil-related industries affect the distribution of value added between counties
Value added per person employed was highest in Oslo and Rogaland in 2010. Meanwhile, household disposable income per capita was relatively evenly distributed across counties.
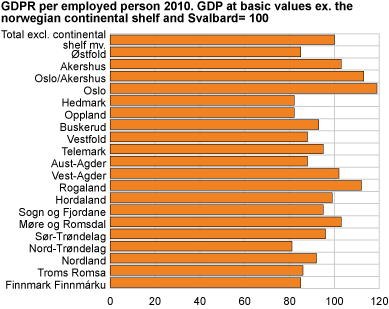
Value added per person employed in Oslo was 19 per cent above the national average in 2010. This must be seen in the context of the industrial structure in Oslo being different from the other counties. For example, nearly half of the production in the banking and financial industries is located in Oslo. This is an industry group that has high value added per employee, regardless of region, and thus increases the average in Oslo relatively more than in the other counties. Similarly, the value added per person employed in the real estate industry is more than double the national average. This industry has greater importance in Oslo than in the other counties. In total, value added of these two industries make up nearly 20 per cent of total value added in Oslo.
Rogaland was 12 per cent above the national average and also has a significant share of service industries with high value added per employee. Although most of the value added in the oil and gas extraction industry is attributed to the continental shelf, this industry still characterises the industry structure in Rogaland. Particularly important is the industry known as service activities incidental to oil and gas, which alone accounted for over 11 per cent of the value added in that region. Over half of the value added of these services came from Rogaland.
Value added per person employed in Akershus, Møre and Romsdal and Vest-Agder was about 3 per cent above the national average, while Hordaland was approximately on the average. The industries that increase value added per person employed in Akershus are essentially the same service industries as in Oslo.
In Møre and Romsdal and Vest -Agder, manufacturing contributed to over 20 per cent of value added in 2010. This industry was characterised as having a value added per employee well above average. It was particularly building of ships, oil platforms and modules and production of basic metals that pulled up value added in Møre and Romsdal. In Vest-Agder, in addition to metals, manufacture of electrical equipment and machinery etc. also had high value added per employee. With the exception of metals that are export-oriented, the other two industries are key suppliers to the petroleum industry.
High proportion of general government - low value added per person employed
The lowest value added per person employed is found in Nord-Trøndelag, followed by Hedmark and Oppland. These counties were nearly 20 per cent below the national average. The two northernmost counties, Troms and Finmark, were clearly below average.
Counties that were below the national average had a relatively large share of government services. Value added in general government is conventionally calculated without including return to capital, which is included in market output. This means that the value added per person employed in general government will be lower than, for example, in private services. Looking at the counties mentioned earlier, public services amounted to about a third or more of the value added. For the country as a whole, general government constituted about a fifth of the total value added.
Lower public employment in counties with high value added per person employed
Nearly 50 per cent of those employed worked in the counties of Oslo, Akershus, Hordaland and Rogaland. In all these counties, the proportion of employees working in the general government is below the national average.
For counties that have lower value added per employee than the national average, the proportion of employed persons in general government is mainly above the national average. The two northernmost counties in addition to Nordland particularly stand out with a relatively large number of employees in general government.
Highest household incomes in Sogn and Fjordane
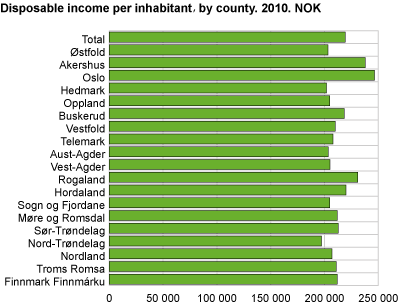
Regional figures for household disposable income per capita show a more even distribution between counties than for value added per employee. Disposable income per capita was highest in Oslo and Akershus, at more than 10 per cent above the national average. In Rogaland, disposable income was 6 per cent above the national average. The inhabitants of Nord-Trøndelag had the lowest disposable income, at 10 per cent below the national average.
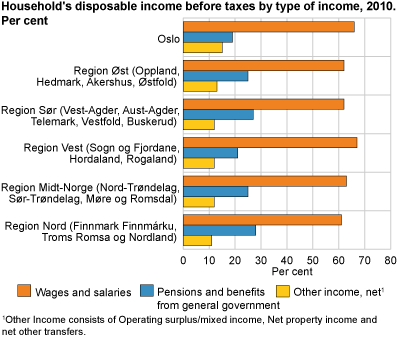
The composition of household income and expenditure varies between counties. Households in Oslo and the Western Region, which consists of Sogn og Fjordane, Hordaland and Rogaland, have a slightly higher proportion of wage income than the other counties, but the differences are relatively small. In the northern region, consisting of Nordland, Troms and Finnmark, public benefits constitute a slightly larger share of household income than in the other counties. Benefit ratios depend partly on demographic conditions. Pensions are the largest form of state benefits, and counties with many pensioners thus have relatively high benefit ratios. The counties of Oslo, Rogaland and Akershus have the lowest percentages of residents over the age of 66, while Hedmark, Oppland and Nordland have the highest proportions.
| GDP2 per inhabitant kr. | GDP per employed persons. NOK | Household Final Consumption Expenditures per innhabitant. NOK | Household's disposable income per inhabitant. NOK | GDP per inhabitant4. Index | GDP per employed persons4. Index | Household's disposable income per inhabitant. Index | |||||||||||||||||||||||||||||||||||||||||||||||||||||||||||||||||||||||||
|---|---|---|---|---|---|---|---|---|---|---|---|---|---|---|---|---|---|---|---|---|---|---|---|---|---|---|---|---|---|---|---|---|---|---|---|---|---|---|---|---|---|---|---|---|---|---|---|---|---|---|---|---|---|---|---|---|---|---|---|---|---|---|---|---|---|---|---|---|---|---|---|---|---|---|---|---|---|---|---|
| Total3 | 520 379 | 982 192 | 212 840 | 219 181 | |||||||||||||||||||||||||||||||||||||||||||||||||||||||||||||||||||||||||||
| GDP at basic values | 462 365 | 872 693 | |||||||||||||||||||||||||||||||||||||||||||||||||||||||||||||||||||||||||||||
| GDP at basic values ex norwegian continental shelf and Svalbard | 364 345 | 692 473 | 100 | 100 | 100 | ||||||||||||||||||||||||||||||||||||||||||||||||||||||||||||||||||||||||||
| østfold | 257 015 | 589 586 | 197 389 | 203 270 | 71 | 85 | 93 | ||||||||||||||||||||||||||||||||||||||||||||||||||||||||||||||||||||||||
| Akershus | 336 337 | 714 373 | 230 970 | 237 852 | 92 | 103 | 109 | ||||||||||||||||||||||||||||||||||||||||||||||||||||||||||||||||||||||||
| Oslo/Akershus | 491 719 | 784 473 | 223 473 | 242 333 | 135 | 113 | 111 | ||||||||||||||||||||||||||||||||||||||||||||||||||||||||||||||||||||||||
| Oslo | 633 485 | 823 623 | 239 292 | 246 422 | 174 | 119 | 112 | ||||||||||||||||||||||||||||||||||||||||||||||||||||||||||||||||||||||||
| Hedmark | 259 618 | 569 237 | 196 034 | 201 875 | 71 | 82 | 92 | ||||||||||||||||||||||||||||||||||||||||||||||||||||||||||||||||||||||||
| Oppland | 263 919 | 565 002 | 198 900 | 204 826 | 72 | 82 | 93 | ||||||||||||||||||||||||||||||||||||||||||||||||||||||||||||||||||||||||
| Buskerud | 311 922 | 643 588 | 212 087 | 218 406 | 86 | 93 | 100 | ||||||||||||||||||||||||||||||||||||||||||||||||||||||||||||||||||||||||
| Vestfold | 272 478 | 610 956 | 203 791 | 209 863 | 75 | 88 | 96 | ||||||||||||||||||||||||||||||||||||||||||||||||||||||||||||||||||||||||
| Telemark | 298 705 | 659 262 | 201 877 | 207 892 | 82 | 95 | 95 | ||||||||||||||||||||||||||||||||||||||||||||||||||||||||||||||||||||||||
| Aust-Agder | 268 272 | 611 443 | 197 647 | 203 535 | 74 | 88 | 93 | ||||||||||||||||||||||||||||||||||||||||||||||||||||||||||||||||||||||||
| Vest-Agder | 356 083 | 706 889 | 199 041 | 204 971 | 98 | 102 | 94 | ||||||||||||||||||||||||||||||||||||||||||||||||||||||||||||||||||||||||
| Rogaland | 434 471 | 776 303 | 224 061 | 230 737 | 119 | 112 | 105 | ||||||||||||||||||||||||||||||||||||||||||||||||||||||||||||||||||||||||
| Hordaland | 370 583 | 685 496 | 213 638 | 220 004 | 102 | 99 | 100 | ||||||||||||||||||||||||||||||||||||||||||||||||||||||||||||||||||||||||
| Sogn og Fjordane | 336 632 | 655 642 | 198 998 | 204 927 | 92 | 95 | 93 | ||||||||||||||||||||||||||||||||||||||||||||||||||||||||||||||||||||||||
| Møre og Romsdal | 360 543 | 715 412 | 205 594 | 211 720 | 99 | 103 | 97 | ||||||||||||||||||||||||||||||||||||||||||||||||||||||||||||||||||||||||
| Sør-Trøndelag | 341 101 | 661 448 | 206 626 | 212 783 | 94 | 96 | 97 | ||||||||||||||||||||||||||||||||||||||||||||||||||||||||||||||||||||||||
| Nord-Trøndelag | 258 791 | 562 199 | 191 579 | 197 287 | 71 | 81 | 90 | ||||||||||||||||||||||||||||||||||||||||||||||||||||||||||||||||||||||||
| Nordland | 308 415 | 637 669 | 201 000 | 206 989 | 85 | 92 | 94 | ||||||||||||||||||||||||||||||||||||||||||||||||||||||||||||||||||||||||
| Troms Romsa | 303 794 | 592 525 | 204 792 | 210 893 | 83 | 86 | 96 | ||||||||||||||||||||||||||||||||||||||||||||||||||||||||||||||||||||||||
| Finnmark Finnmárku | 303 980 | 586 658 | 205 583 | 211 709 | 83 | 85 | 97 | ||||||||||||||||||||||||||||||||||||||||||||||||||||||||||||||||||||||||
| The Norwegian continental shelf mv. | - | 26 758 459 | - | - | - | - | - | ||||||||||||||||||||||||||||||||||||||||||||||||||||||||||||||||||||||||
| 1 | In the table, the national average excluding Svalbard and the Continental shelf is set to 100. |
| 2 | GDP for regions at basic values. |
| 3 | GDP total at marked values. |
| 4 | GDP at basic values ex norwegian continental shelf and Svalbard. |
|
To compare the level figures on gross domestic product (GDP) per county makes little sense given that there are large differences between counties in terms of population. In order to obtain a better basis for comparison, the distribution is either GDP per capita or per employee. The commuting across regions, for example, that many of the workers in Oslo who live outside the metropolitan area do, means that GDP per capita can be difficult to compare. The interest should therefore be directed at the figures showing GDP per employed person. GDP per employed person should not be interpreted as an analysis of differences in productivity between counties. If a productivity analysis was to be done it would be necessary to take into account the stock of real capital in the counties. The article focuses on GDP per employed person, but the tables also show GDP per capita. In November 2012, ??some revisions were made in the annual national accounts for the years 2008 and 2009. In accordance with these changes, the regional figures for the two years are reconciled again. The industries oil and gas extraction and services incidental to oil and gas have been revised. No other changes have been made. |
|
Value added for a market-oriented industry can been calculated by subtracting intermediate consumption from production, or by summing up compensation of employees, consumption of fixed capital, other net taxes on production and operating surplus. Value added= Production - Intermediate consumption Value added = Compensation of employees + Consumption of fixed capital + other net taxes on production + operating surplus. For general government, the calculation of value added is somewhat different. Operating surplus in general government is per definition equal to zero and value added is calculated as shown below: Value added for general government = Compensation of employees + Consumption of fixed capital + other net taxes on production |
Tables:
Contact
-
Edita Zahirovic
E-mail: edita.zahirovic@ssb.no
tel.: (+47) 40 90 26 12
-
Julian Paulsen Blytt
E-mail: julian.blytt@ssb.no
tel.: (+47) 40 90 23 26


