Content
Published:
Next release:
NOK 26 700 per capita in specialist health service
Operating expenses in the specialist health service were NOK 139 billion in 2015. This is 27 per cent more than five years ago. On average, this corresponds to NOK 26 700 per capita in 2015.
| 2015 | Change in per cent | ||
|---|---|---|---|
| 2014 - 2015 | 2011 - 2015 | ||
| 1The figures are in current prices. Due to the effect of the Pension cost reform in 2014, changes from last year are not calculated. | |||
| 2Bed-days and discharges in 2015 do not include healthy new-borns in hospitals. The number therefore cannot be compared directly with previous years, when healthy new-borns where included. | |||
| 3"Man-years" refer to "Contracted man-years unadjusted for long term leaves". Due to change of data source, changes in man-years are not calculated. | |||
| Specialist health service | |||
| Expenses (NOK million)1 | 139 338 | : | 27 |
| Expences per inhabitant (NOK)1 | 26 700 | : | 22 |
| Beds | 19 519 | -1 | -6 |
| Discharges2 | 852 868 | : | : |
| Bed-days2 | 5 715 331 | : | : |
| Out-patient consultations | 8 741 206 | 9 | 23 |
| Day cases | 416 640 | -17 | -13 |
| Man-years3 | 122 291 | : | : |


Measured in constant prices, the operating expenses in the specialist health service were 5 per cent higher than in 2011. The rise in population was a bit lower, at just below 5 per cent. This means that the amount used per capita was almost the same in 2015 as in 2011.
Less change per capita
When we compare per capita expenses in constant prises, the expenses for general hospitals increased slightly from 2011. This increase is in particular connected to growth in lab and roentgen services. Per capita expenses for treatment of substance abuse also increased, while per capita expenses for psychiatric hospitals and institutions declined.
Highest amount spent on treatment of physical diseases and injuries
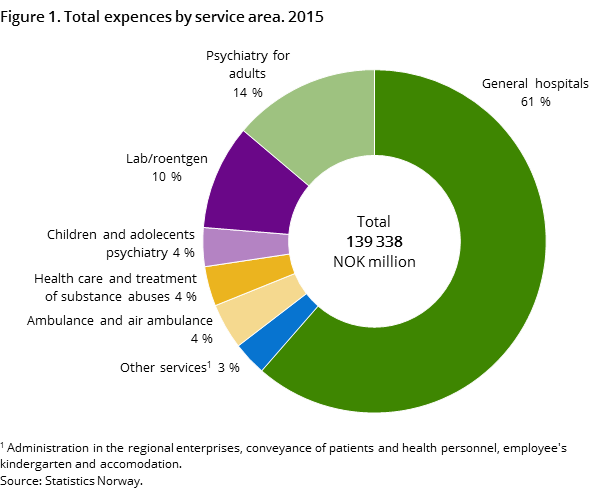
In 2015, NOK 85.5 billion was spent in general hospitals, mainly for the treatment of physical diseases and injuries. This equals NOK 16 400 per capita.
Lab and roentgen services are usually linked to diagnosis and follow-ups in general hospitals. These services amounted to NOK 13.8 billion, or 10 per cent of the total expenses.
Expenses for psychiatric treatment, including treatment of substance abuse, made up almost 20 per cent of the total in 2015. Per capita expenses were NOK 9 600. Figure 1 shows the distribution of expenses into different functions.
Higher expenses in the north
Per capita expenses are higher in the northern part of Norway (Health region North) than in other regions. Long distances from home to hospital can partly explain this. Expenses for ambulance services and transportation of health personnel and patients are higher here than in the rest of Norway.
Per capita expenses in Health region North were NOK 900 higher than in Health region West, which has the lowest per capita expenses.
We know that the elderly are more frequent users of health services than younger people. The population in the western part of Norway is younger than in other parts of Norway.
4 in 10 were treated in hospital
Patient statistics from Statistics Norway show that 1.9 million Norwegians were treated in general hospitals in 2015. This corresponds to 36 per cent of the population.
Out-patient treatment is used more than before in hospitals as well in other institutions in the specialist health service. In 2015, 8.7 million consultations were conducted. Two thirds of this was in general hospitals and the rest was in psychiatric institutions, including institutions for substance abuse treatment.
Private institutions important in treatment of substance abuse
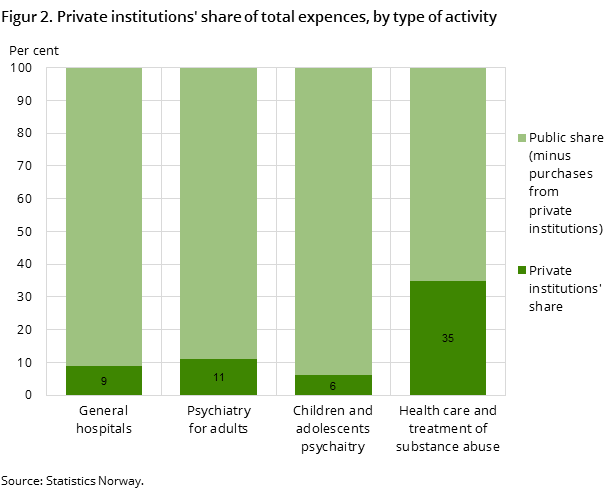
Both public and private hospitals and institutions provide specialist health services, but different types of services are dominant in the two sectors. The private sector’s share is highest for substance abuse treatment. The Health Enterprises cooperate with private parties to provide substance abuse treatment.
Figure 2 shows the share of expenses in private institutions for substance abuse treatment was substantially higher than in other services. The private sector’s share reached 30 per cent of the total expenses in this service.
Occupancy rate
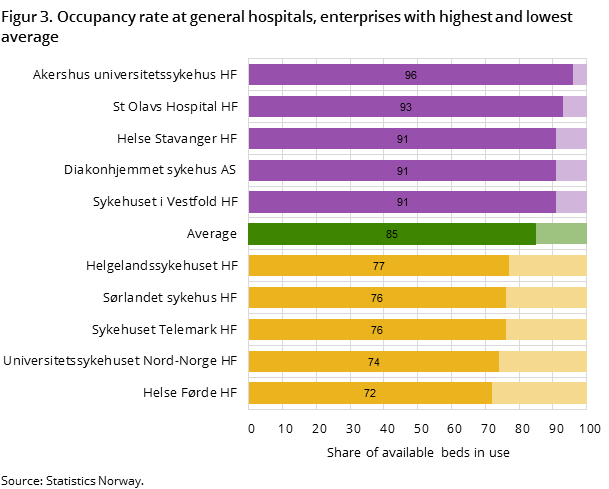
Almost 9 out of 10 beds in general hospitals were occupied on an average day in 2015. Hospitals need a certain amount of unoccupied capacity in case of unplanned admissions. Hospitals have many admissions of patients in acute need of help.
The occupancy rates vary from hospital to hospital. Figure 3 shows the general hospitals with the highest and the lowest occupancy rates in 2015.
It is crucial to take geography and travelling time into account when interpreting the occupancy rate. The density of hospitals is especially high in and around Oslo. Here it is possible to cooperate when it comes to acute admissions. In more rural areas, the travelling times are often much longer, which make such cooperation difficult.
Majority are nurses
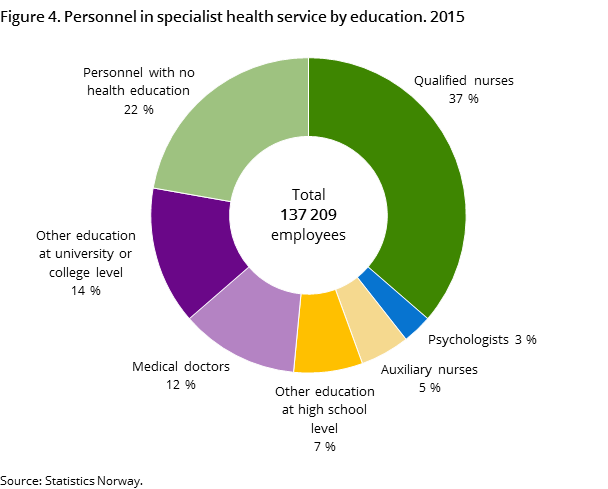
About 137 200 persons worked in specialist health services in 2015. This corresponds to approximately 122 300 man-years. Because of a new source for personnel data in 2015 (see text box), man-years adjusted for compensated absence from work due to illness or maternity leave cannot be estimated this year. This new data source is also the reason why changes in numbers and rates are not examined.
Thirty-seven per cent of the employees are qualified nurses. Figure 4 shows the distribution of employees by education.
New source for personnel dataOpen and readClose
From 2015 and onwards the register-based employment statistics are based on a new data source for employees. Because of the change of data source, man-years adjusted for long term leave will not be published for 2015. A common reporting system called “a-ordningen” is used for coordinated reporting of employees to the Norwegian Labour and Welfare Organisation, earnings to the Tax Administration and personnel data to Statistics Norway. For more information on the new data source, see About the statistics, Employment register based.
Why is the occupancy rate reduced?Open and readClose
The 2015 rate is lower than the 2014 and 2013 rates, which Statistics Norway has presented previously. The 2015 rate is more accurate. Statistics Norway has improved the comparability between the activity and capacity used to calculate the occupancy rate. Firstly, more of the hospitals’ capacity is included in 2015. Secondly, bed-days for healthy new-borns are excluded from the 2015 activity. Statistics Norway’s numbers for capacity count the mother and the healthy new-born as one unit.
As in previous years, leave days are included in the bed-days. This may give a higher occupancy rate than the actual figure.
Contact
-
Spesialisthelsetjenesten
E-mail: spesialisthelsetjenesten@ssb.no
-
Borgny Vold
E-mail: borgny.vold@ssb.no
tel.: (+47) 48 07 81 08
-
Geir Hjemås
E-mail: geir.hjemas@ssb.no
tel.: (+47) 93 08 27 75
-
Emshaw Degife Gurmu
E-mail: emshaw.degife.gurmu@ssb.no
tel.: (+47) 40 90 23 27
-
Ingrid Hatlebakk Hove
E-mail: ingrid.hatlebakk@ssb.no
tel.: (+47) 91 88 14 28
