Content
Published:
Updated:
This is an archived release.
Stable cost and activity
The statistics show a small change in cost level, man-years, capacity and activity in 2013. The cost related to specialist health services were NOK 121 billion in 2013.This is an increase of 4 per cent. The purchase of health services from the private providers is also stable.
| Absolute figures | Change in per cent | ||
|---|---|---|---|
| 2013 | 2012 - 2013 | 2009 - 2013 | |
| 1The specialist health service includes production in both private sector and the Government. | |||
| 2The numbers can not be compared directly with previous years, due to a minor change in the hospital financing system. | |||
| 3StatRes includes specialist health services produced by the governmental institutions (Health enterprises). | |||
| Specialist health service1 | |||
| Expenses (incl. depreciation) (NOK million) | 120 899 | 4 | 22 |
| Beds | 19 600 | -2 | -10 |
| Discharges | 988 997 | 1 | 3 |
| Bed-days | 5 968 038 | -3 | -11 |
| Out-patient consultations2 | 7 651 917 | 3 | 22 |
| Day-cases2 | 491 130 | 1 | -26 |
| Contracted man-years adjusted for long term leaves | 102 079 | 1 | 5 |
| StatRes Specialist health service3 | |||
| Own production specialist health services (mill. NOK) | 101 015 | 5 | 23 |
| Beds | 15 206 | -1 | -8 |
| Bed-days | 4 669 725 | -3 | -8 |
| Discharges | 895 927 | 1 | 5 |
| Day-cases2 | 411 546 | -2 | -31 |
| Out-patient consultations2 | 7 134 510 | 3 | 21 |
| Contracted man-years adjusted for long term leaves in specialist health services | 90 920 | 1 | 7 |


In 2013, there were around 102 000 man-years ; slightly more than in 2012, and these were performed by just over 130 200 persons. Measured in man-years, the specialist health services constitute 45 per cent of the total man-years in the health and social care sector.
Majority are nurses
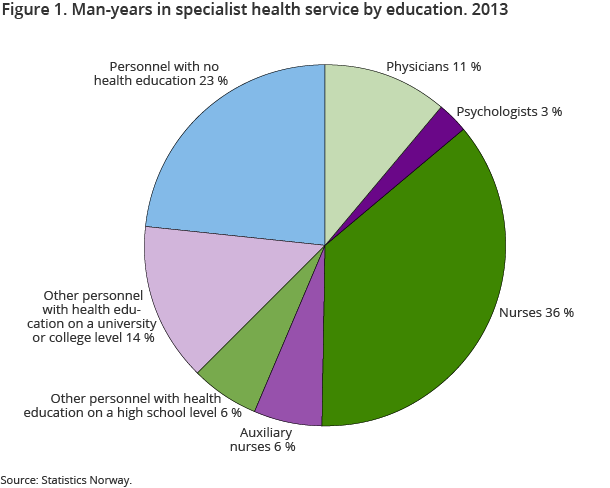
Nurses make up the largest group of employees in the specialist health services, with more than one third of all employees. The next largest group is persons without a health and social care education, and these make up almost a quarter of employees. This group includes persons currently in education who are not yet qualified health care workers, employees in administration, and unskilled nursing staff. Figure1 shows how employees are distributed among the various educational groups.
7 out of 10 NOK to general hospitals
In current prices, there has been a 4 per cent increase in costs to the specialist health services from 2012 to 2013. If we look however at constant 2005 prices, the increase is very modest. Figure 2 shows that the general hospitals constitute the largest part of specialist health care services. More than 70 per cent of operating expenses went to general hospitals, while psychiatric health care and multidisciplinary specialist substance abuse treatment combined amounted to a fifth of the total cost.
Higher rise in psychiatric health care
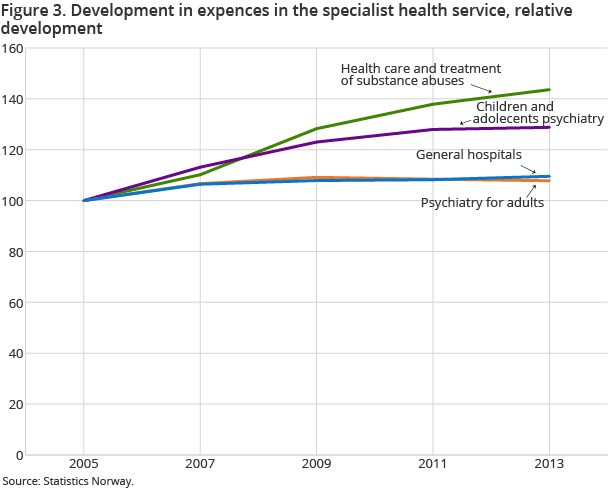
In a longer time perspective, increases are higher in psychiatric health care and multidisciplinary specialised substance abuse treatment than in general hospitals. Figure 3 shows how the costs have evolved in certain parts of the service from the baseline in 2005 to 2013. This figure shows developments in fixed 2005 prices, not the cost level.
Mostly own production
Costs of own production (StatRes) for health enterprises accounted for 84 per cent of the total operating costs in 2013. Meanwhile, 81 per cent of the employment related to the health enterprises. The private enterprises that have long-term contracts with health authorities are the largest private health providers, measured in terms of costs and man-years.
Shorter hospitalisations in psychiatric health care
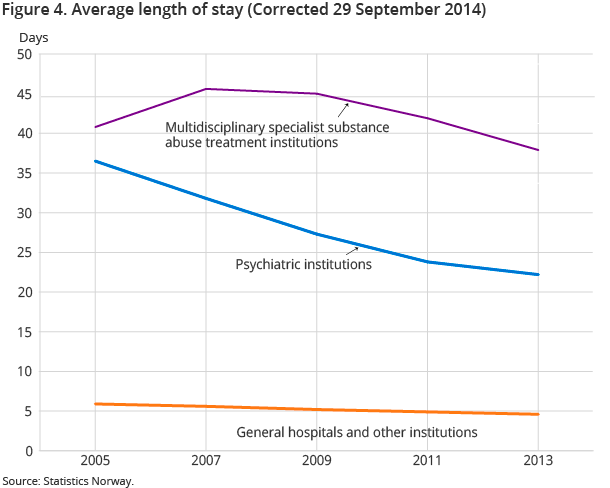
Figure 4 shows that the average length of hospital stays in somatic institutions has remained stable since 2005. The length of stay for psychiatric health care has been reduced considerable for the same period. There are several reasons for the decline. A number of patients who were previously admitted to hospital wards with long stays have been transferred to the community health services or to nursing homes. Meanwhile, investments in community-based psychiatric centres (DPS) and a strengthening of the outpatient care have contributed to shorter hospital stays. From 2005 to 2013, the number of outpatient consultations increased by almost 90 per cent in psychiatric health care. The decline in the average length of stay in substance abuse treatment has many similarities with that found for psychiatric health care.
Most 24-hour stays are in ordinary hospitals
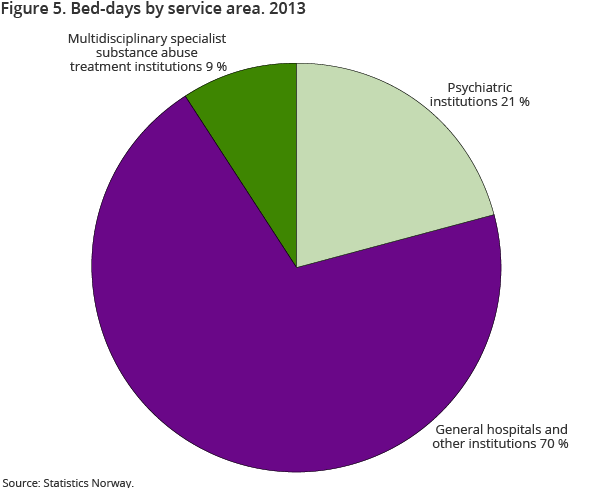
In 2013, the institutions in the specialist health services had almost 6 000 000 bed days. Six out of ten bed days were in general hospitals. With regard to the diagnosis of hospitalised patients, diseases of the circulatory system (cardiovascular disease) and tumours contribute to the highest number of bed days in hospital. Every tenth hospitalisation in the specialist health service was in a rehabilitation institution. Figure 5 illustrates the distribution of bed days over the service areas general hospitals and institutions, psychiatric institutions and drug treatment units.
Figures for institutions will not be published in StatBank Open and readClose
From 2013 onwards, the lowest level in the Statbank tables is the Health Enterprise (HF). Due to the substantial changes in the institutional level from year to year, comprehensive explanations are required for the dissemination of the statistics at this level. When the purpose of statistics is to provide time series, the Health Enterprise level (HF) is more relevant.
Previously published institutional figures are available and the figures from 2013 onwards may be provided on request. Please contact the contact person for the statistics if you have a need for institution numbers. Delivery of data at the institutional level can be implemented as assignments.
Contact
-
Spesialisthelsetjenesten
E-mail: spesialisthelsetjenesten@ssb.no
-
Borgny Vold
E-mail: borgny.vold@ssb.no
tel.: (+47) 48 07 81 08
-
Geir Hjemås
E-mail: geir.hjemas@ssb.no
tel.: (+47) 93 08 27 75
-
Emshaw Degife Gurmu
E-mail: emshaw.degife.gurmu@ssb.no
tel.: (+47) 40 90 23 27
-
Ingrid Hatlebakk Hove
E-mail: ingrid.hatlebakk@ssb.no
tel.: (+47) 91 88 14 28
