Content
Published:
This is an archived release.
Stable divorce numbers
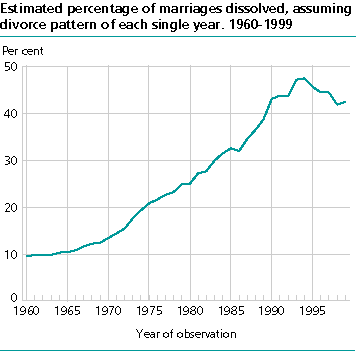
In 1999, 9 100 marriages were dissolved by divorce, a modest decline from the previous year. At the same time, the estimated divorce percentage remained stable. If we use the divorce pattern from 1999 as a basis, 42 per cent of all marriages contracted this year will end in divorce.
Divorce percentages this high have not been registered in any marriage cohort to this day. The biggest percentage of divorces is among those who married 15-30 years ago. Of everyone who married during this period, at least 28 per cent of the original marriage cohorts ended in divorce, but no marriage cohorts have passed 30 per cent so far. However, a number of the marriage cohorts have a number of years left before we will have a final summary of any break-ups.
The divorce percentages of the individual marriage cohorts have increased dramatically in the last 50 years. There are now some signs of a break in this trend. For example, after nine years of marriage, couples who married in 1990 had a somewhat lower divorce percentage, 18, than those who married in 1985, with 20.
Unchanged for silver anniversary couples
The divorce rate varies greatly by the duration of the marriage. In 1998 the divorce rate per 1 000 existing marriages was 29, 22, 16, 14 and 10 respectively for marriages lasting 5, 10, 15, 20 and 25 years. The decline in the divorce rate in recent years is quite evident when we look at marriages that have lasted 10 years. Marriages of longer duration have seen neither a similar decline nor a major increase. In the last 10 years the divorce rate of marriages that have lasted so long that they are close to the silver anniversary mark, has remained relatively unchanged. For marriages lasting 20 years, the annual average has stayed at just over 14 divorces per 1 000 existing marriages. A slight increase has been seen in marriages lasting 25 years. In the last 10 years, there has been an average of just over 10 divorces per 1 000 marriages of such long duration.
Quite stable agewise
The divorce rate for men and women in different age groups was quite stable, but showed a slight increase from the year before for most age groups. 30-34 year olds, particularly women, got divorced slightly less often. This was previously the age group with the highest divorce rate. It is too soon to say anything certain about a permanent change here, though.
Small increase in separations
The number of separations increased again in 1999, by 300 to 11 900, after remaining at a lower level for some years. In addition to the 9 100 marriages dissolved by divorce, 16 900 marriages were dissolved by the death of a spouse.
14 500 children experienced a divorce
Well over half (56 per cent) of the couples who divorced in 1999 had children under the age of 18. The total number of children involved was 9 000. A further 5 500 children were 18 or older at the time of their parents divorce. Because the statistics do not give numbers for dissolved cohabitant relationships, the information about break-ups of couples is not complete. One result of this is that the number forchildren who experience the break-up of their family is too low.
Statistical changes
Compared with the previous year, the divorce statistics for 1999 are different on two counts: Firstly, all delayed reports of separations and divorces are included in the statistics regardless of when the event occurred. Secondly, the figures cover divorces and separations in which the man is a resident of Norway, instead of cases in which at least one of the parties is a resident of Norway. Statistics using the old definition are available. See also About the statistics.
Tables:
- Table 1 Marriages dissolved. Separations. 1961-1999
- Table 2 Divorces and separations. County. 1981-1999
- Table 3 Divorce rates for males and females in different age groups. 1959-1999
- Table 4 Divorces, by number of children and duration of marriage. 1999
- Table 5 Divorces, by age of wife and husband at divorce. 1999
- Table 6 Divorces 1999. Citizenship of female and male
- Table 7 Children under 18 years of age involved in divorces. County. 1999
This page has been discontinued, see Marriages and divorces, Annually, detailed figures.
Contact
-
Anders Sønstebø
E-mail: anders.sonstebo@ssb.no
tel.: (+47) 46 66 37 74
-
Ane Margrete Tømmerås
E-mail: ane.tommeras@ssb.no
tel.: (+47) 91 99 29 62
-
Espen Andersen
E-mail: espen.andersen@ssb.no
tel.: (+47) 92 61 00 46
-
Statistics Norway's Information Centre
E-mail: informasjon@ssb.no
tel.: (+47) 21 09 46 42
-
Oppdrag befolkningsstatistikk
E-mail: befolkning@ssb.no

