
Population and Housing Census 2001, preliminary figures
More persons live alone
The number of households and dwellings increased by 11 per cent from 1990 to 2001. The number of dwellings where only one person lives increased by almost 20 per cent. In each dwelling there are fewer persons living when at the same time the portion of dwellings with five rooms or more increases.
These are some preliminary figures from the Population and Housing Census 2001.
The figures give an overview of the number of households and describe the dwellings where the households live. By households we mean the persons who live in the same dwelling. Accordingly there is the same number of households as there are dwellings. Altogether there are 1,955,000 inhabited dwellings and households in Norway 3 November 2001. There is an average of
2.3 occupants in each dwelling. 37 per cent of the households consist of one person. 13 per cent of the population live in dwellings with one or two rooms, and 49 per cent live in dwellings with five rooms or more.
424,000 persons are cohabitants and thereby make up 20 per cent of the couples.
The preliminary figures give distributions according to where a person was living 3 November 2001 (formal residence). This means that all the unmarried students, who are registered as living with their parents, are included in the parents' household. The final figures will show where the students actually live. This will increase the total number of households and their dwellings to over two million. The figures we now present are, however, comparable to previous Population and Housing Censuses.
Figures may be changed
The figures presented here are based on a nation-wide selection of 15,782 answers to the housing forms, and may therefore occasionally deviate from the final figures.
Two out of three live in single family homes
720,000 live alone
For more information please contact: paul.inge.severeide@ssb.no, telephone +47 62 88 52 90, coen.hendriks@ssb.no, telephone +47 62 88 52 49 or even.hoydahl@ssb.no, telephone +47 62 88 51 48.
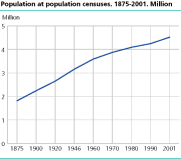
- Table 1 Population at population censuses, by county. 1875-2001
- Table 2 Population, by age. 1900-2001. Per cent
- Table 3 Population, by sex, age and type of household. 3 November 2001
- Table 4 Families and persons in private households, by type of family and region. 3 November 2001
- Table 5 Dwellings, by type of building and number of rooms. Occupants, by number of rooms. 1980, 1990 and 2001. Numbers and per cent
- Table 6 Occupants and occupants per dwelling. Dwellings, by number of rooms. County. 3 November 2001. Numbers and per cent
- Table 7 Dwellings, by type of building and region. 1990 and 2001. Per cent
- Table 8 Dwellings, by number of rooms and county. 1990 and 2001. Per cent
- Table 9 Dwellings, by number of rooms and number of occupants. 3 November 2001. Numbers and per cent
- Table 10 Dwellings, occupants and rooms, by type of building. 1980, 1990 and 2001
- Table 11 Dwellings, by tenure status, floor space, type of building and type of household. 3 November 2001. Per cent
- Table 12 Dwellings, by tenure status and county. 1990 and 2001. Per cent
- Table 13 Dwellings, by tenure status and age of the oldest person in the household. 1990 and 2001. Numbers and per cent
- Table 14 Dwellings, by floorspace and region. 3 November 2001. Numbers and per cent
- Table 15 Dwellings, by year of construction, type of building, tenure status and systems for heating. Occupants, by year of construction. 1980, 1990 and 2001
- Table 16 Dwellings, by year of construction of the building and county. 3 November 2001. Per cent
- Table 17 Dwellings, by source of energy for heating and county. 3 November 2001. Per cent
- Table 18 Persons in private households, by age and standard indicators for the dwelling. 3 November 2001. Per cent
- Table 19 Persons in private households, by type of household. Private households, by type of household, tenure status and number of rooms in the dwelling. 3 November 2001. Per cent
- Table 20 Private households and persons in private households, by size of household and type of household. 3 November 2001. Numbers and per cent
- Table 21 Private households and persons per private household, by county. 1960, 1970, 1980, 1990 and 2001
- Table 22 Persons 67 years and older in private households, by age, number of persons in the household and standard indicators for the dwelling. 3 November 2001. Per cent
- Table 23 Main figures for couples and persons living as couples. 3 November 2001. Numbers and per cent
- Table 24 Couples with and without children, by way of living together. 1990 and 2001. Numbers and per cent
© Statistics Norway
