Content
Published:
This is an archived release.
Trade surplus down
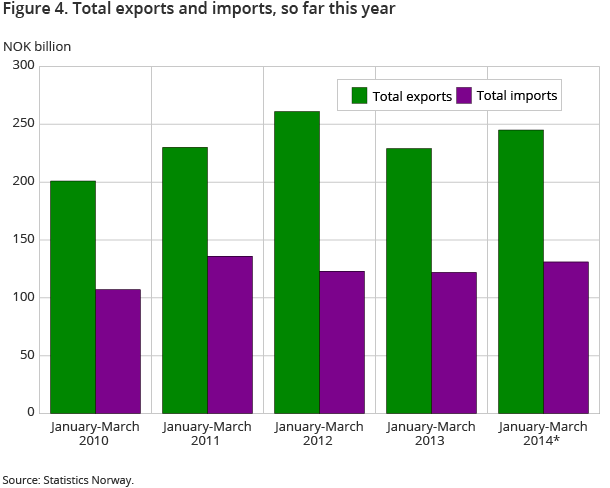
Exports of goods came to NOK 77.7 billion, while imports reached NOK 46.3 billion in March 2014. Thereby the trade surplus dropped 19.2 per cent compared to March 2013. There was a high export of fish and record high for electric cars.
| NOK Million | Change in per cent | NOK Million - so far this year | Change in per cent - so far this year | ||
|---|---|---|---|---|---|
| March 2014 | February 2014 - March 2014 | March 2013 - March 2014 | March 2014 | March 2013 - March 2014 | |
| 1The figures are marked with the symbol *. This is Statistics Norways standard symbol for indicating preliminary figures. | |||||
| 2Due to the data collection method, the preliminary monthly figures published for ships and oil platforms are often incomplete. In retrospect, therefore, the trade in these goods could in some cases lead to major corrections in the figures. Please see tables 2-4 for the impact these figures have on the external trade. | |||||
| Imports | 46 325 | 7.3 | 20.5 | 131 494 | 8.2 |
| Ships and oil platforms2 | 90 | 1 400.0 | -83.5 | 589 | -73.4 |
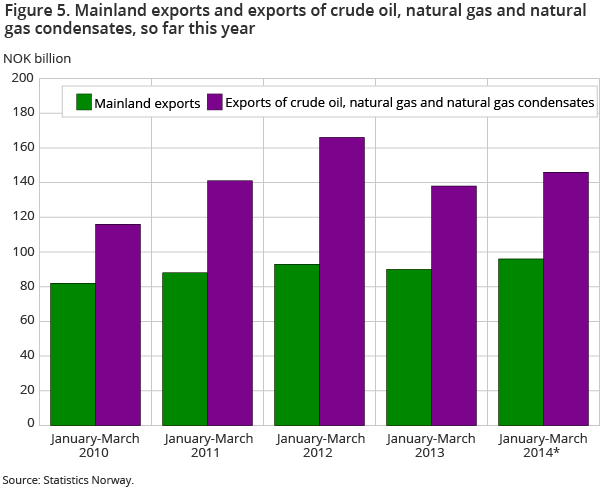
| Exports | 77 734 | 0.9 | 0.6 | 245 063 | 6.8 |
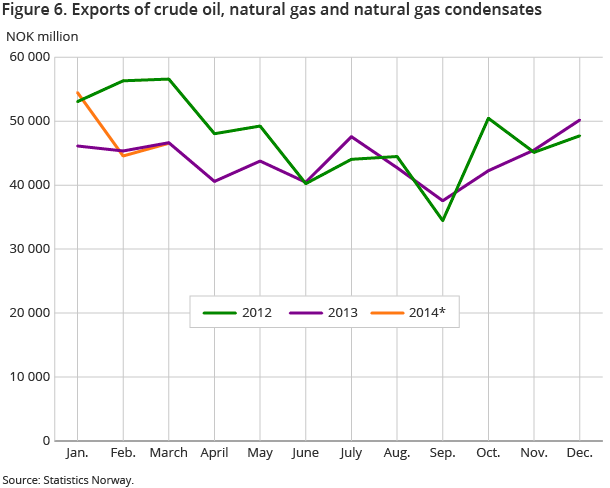
| Crude oil | 23 909 | 7.4 | -2.0 | 75 293 | 8.3 |
| Natural gas | 21 960 | 4.6 | 2.4 | 67 758 | 2.5 |
| Natural gas condensates | 681 | -47.3 | -15.4 | 2 559 | 1.4 |
| Ships and oil platforms2 | 73 | -93.9 | -88.0 | 3 219 | 120.3 |
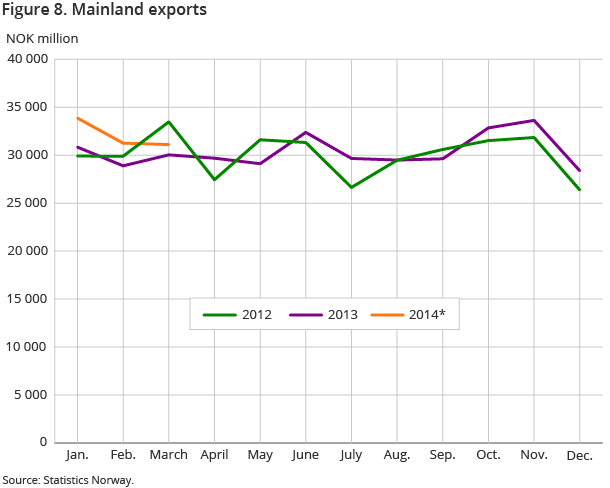
| Mainland exports | 31 110 | -0.5 | 3.6 | 96 235 | 7.2 |
| The trade balance | 31 409 | -7.2 | -19.2 | 113 570 | 5.4 |
| The mainland trade balance | -15 125 | -27.0 | -92.6 | -34 669 | -17.1 |
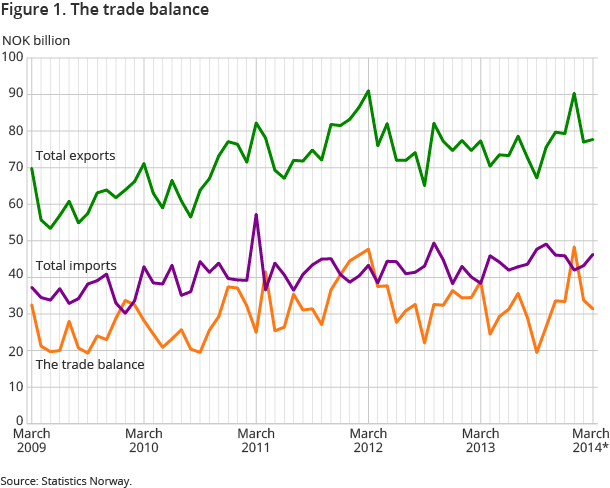
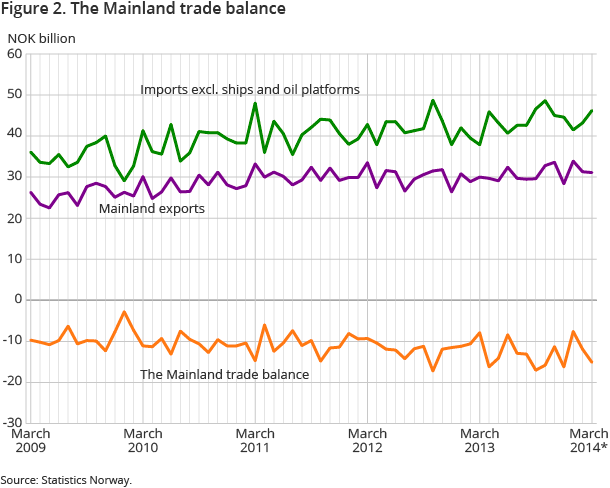
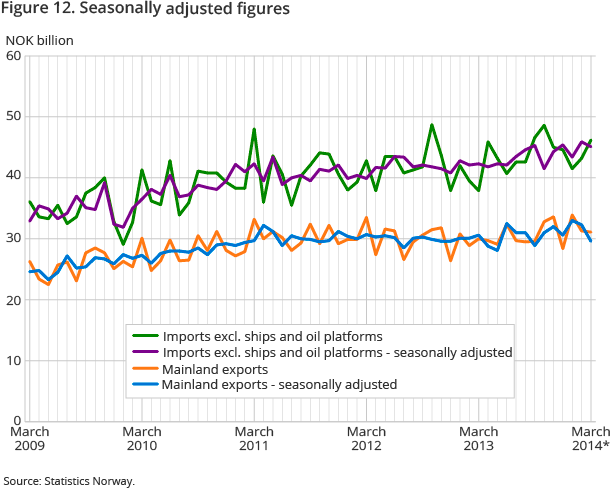
The trade balance for March 2014 ended at NOK 31.1 billion. This was NOK 7.4 billion – or 7.2 per cent – lower than March last year. The reason for the drop was mainly due to higher imports. It is important to consider the fact that Easter was in March in 2013 and thereby influences the figures. The seasonally-adjusted figures show a much lower growth in imports. Corresponding figures for exports show minor adjustments.
Minor changes in exports of crude oil and natural gas
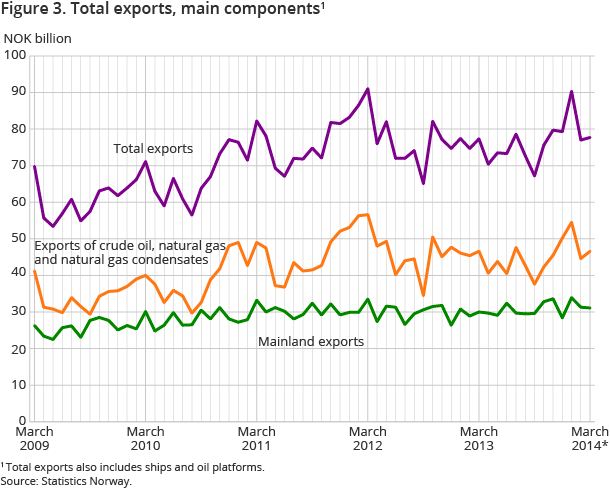
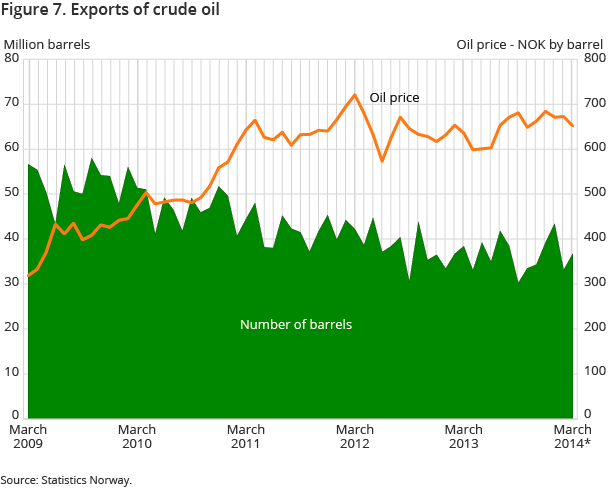
Norway exported crude oil amounting to NOK 23.9 billion in March 2014. Compared to last year, this was a small decline of NOK 489 million – or 2.0 per cent. The price of crude oil in the first three months of 2014 was higher than last year. In March 2014 it was NOK 652, which is about NOK 16 more than in March 2013. However, the number of barrels exported this March was down 1.7 million or 4.4 per cent from March 2013.
The exported value of natural gas came to NOK 22.0 billion in March 2014. This was up NOK 519 million, or 2.4 per cent from March 2013. The volume of gas in a gaseous state was up 9.8 billion cubic metres; a growth of 2.6 per cent compared to March 2014.
High exports of fish
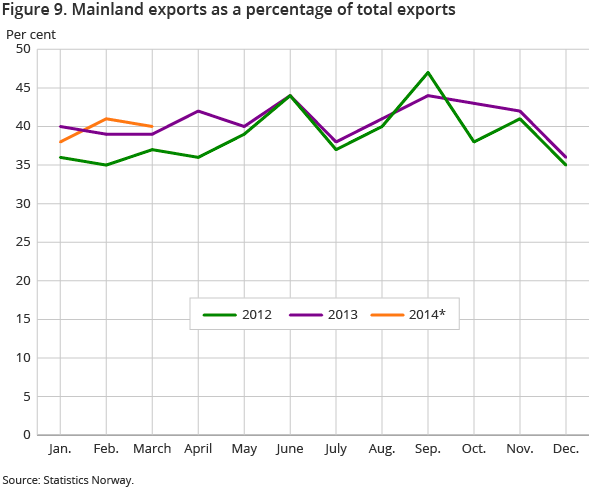
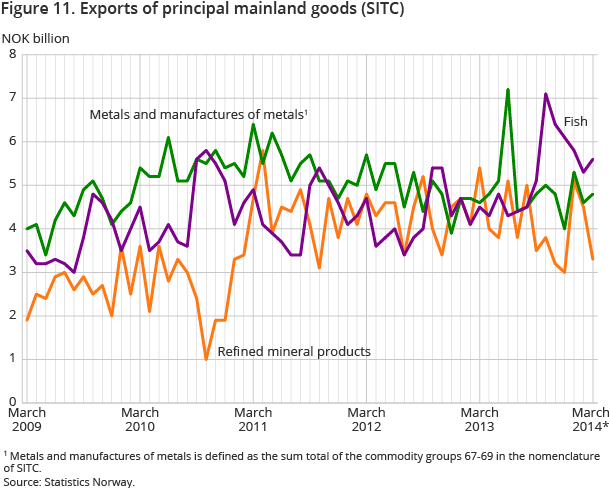
The mainland exports ended at NOK 31.1 billion in March 2014. The rise was NOK 1.1 billion – 3.6 per cent up from March 2013. There were small changes in most of the main commodity groups, however fish pushed up the export figures and refined mineral products had the opposite effect.
Fish exports were up NOK 1.2 billion; a rise of 25.9 per cent compared to March 2013. The export of fresh salmon amounted to almost NOK 3 billion in March 2014, up about NOK 580 million compared to last year. The price was slightly more than NOK 6 higher.
The group of refined mineral products dropped by almost NOK 2.2 billion, or 40.3 per cent. However, the big drop is due to the fact that this export was high in March 2013. With regard to other important export products, such as iron and steel and non-ferrous metals, there were only minor changes. However, manufactures of metals were up 37.7 per cent - NOK 196 million.
Record high for electric car imports
The import value of goods came to NOK 46.3 billion in March 2014. The growth in unadjusted figures was NOK 7.9 billion, or 20.5 per cent compared to last year.
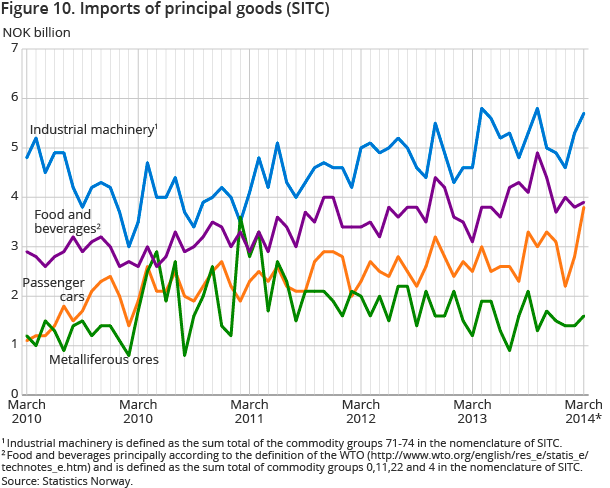
In March 2014, imports of machinery and transport equipment in particular were up. The growth compared to March last year was NOK 3.4 billion. There was a jump in the import of road vehicles, and passenger cars alone were up by NOK 1.2 billion ending at NOK 3.8 billion. This record is due to the import of electrical cars. The import value of these cars was almost NOK 1.1 billion in March 2014 – while in March the previous year it was only NOK 140 million.
Furthermore, the total import of industrial machinery was up NOK 1.1 billion from March 2013 to March 2014.
Contact
-
Information services external trade
E-mail: utenrikshandel@ssb.no
-
Nina Rolsdorph
E-mail: nina.rolsdorph@ssb.no
tel.: (+47) 41 51 63 78
-
Jan Olav Rørhus
E-mail: jan.rorhus@ssb.no
tel.: (+47) 40 33 92 37
