Content
Published:
This is an archived release.
Boys well represented in both highest and lowest proficiency levels
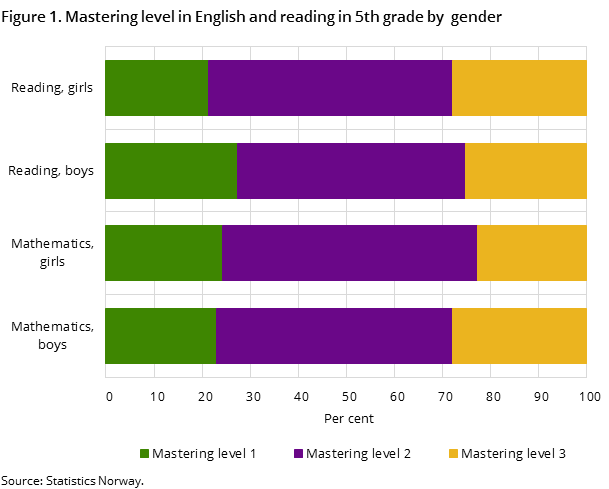
Boys distinguish themselves at the highest proficiency level in two out of three national tests completed in 2015. However, more boys than girls also have the lowest proficiency level in all tests. The girls score high in reading, while the smallest gender gap is in English skills.
| 2015 | |||
|---|---|---|---|
| Proportion of pupils who achieved the lowest level. English 5th grade | Proportion of pupils who achieved the lowest level. Reading 5th grade | Proportion of pupils who achieved the lowest level. Mathematics 5th grade | |
| All pupils | 25.5 | 24.4 | 23.7 |
| Sex | |||
| Boys | 26.3 | 27.4 | 23.0 |
| Girls | 24.7 | 21.3 | 24.3 |
| Immigration category | |||
| Immigrants | 27.7 | 40.6 | 36.1 |
| Norwegian-born to immigrant parents | 24.6 | 34.8 | 33.9 |
| Other pupils | 25.4 | 22.4 | 21.9 |
| Parents' educational attainment level | |||
| Parents do not have tertiary education | 33.3 | 34.4 | 34.1 |
| Parents have tertiary education | 20.5 | 17.4 | 16.5 |


The statistics on national tests and marks in lower secondary school normally show a positive correlation with school achievements and social background. The statistics also show that immigrants achieve lower results than other pupils, and that girls are likely to get better results than boys. This trend continued in the 2015 results, but the gender gap is evening out.
Bigger difference between boys
Although the score points from 2015 show marginal disparities between the sexes, some patterns can be clearly seen in how the pupils are distributed between the different proficiency levels. Boys’ results are generally more dispersed, while girls who do not achieve the highest proficiency level often end up in the levels just below.
The results from 2015 show that more boys than girls achieve the highest proficiency level in two out of three tests in both the 5th and 8th grade. Using the mathematics test as an example, we see that 27.9 per cent of boys in the 5th grade score in the highest proficiency level, while 22.7 per cent of the girls achieve the same result. The distribution of the groups in the two other proficiency levels, however, indicates that girls and boys perform equally on average.
Girls fare better in reading tests, where they achieve the highest proficiency level in all stages, and somewhat higher score points than the boys. The majority of the pupils who achieve high scores in both mathematics and reading tests have parents with a higher education. Immigrants and Norwegian-born to immigrant parents tend to achieve below average results on these tests. This is particularly evident in the results of 8th grade pupils’ reading tests, where immigrants typically achieve 7 fewer points than other pupils.
English results remain evenly distributed
The English test is taken in the 5th and 8th grade, and shows a smaller disparity in gender and parents’ education level than the two other tests. As an example, 16.4 per cent of pupils with parents with no tertiary education achieved the highest proficiency level in English. By comparison, the corresponding figure for the mathematics test was 9.3 per cent. Both of these figures are of pupils in 5th grade.
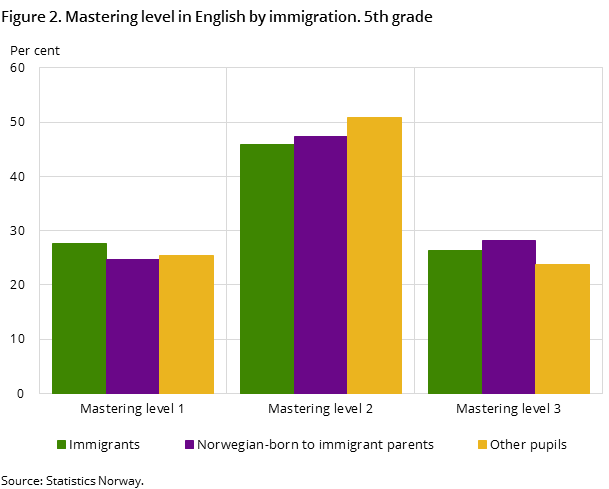
Results from the English test also show less disparity between pupils with different immigration backgrounds. In the 5th grade, more immigrants and Norwegian-born to immigrant parents achieved the highest proficiency level than other pupils. This picture evens out, however, when we look at the results as a whole. We can then see that the latter group is distributed into a higher share at the middle proficiency level and fewer pupils in the lower proficiency level.
Score points unchanged
Score points were introduced in 2014 for the English and mathematics tests, and the figures from 2015 show a marginal change in overall results. Some counties and groups have only gone up or down by one point, which does not affect the national average. This is as expected, since the points are intended to show how the pupils’ results develop over the years.
Score points will be introduced for the reading test in 2016, when this test will also be made electronic.
New scale for publication of results – score pointsOpen and readClose
From 2014, the results can be measured in points in addition to mastering levels. The average score point is set at 50, with the standard deviation 10. To create this scale, which reflects the pupils’ skills and results in the national tests, the methodology Item Response Theory (IRT) has been used. Accordingly, the pupils’ results have been converted into score points where the average was set at 50. More information about the new scale can be found in “About the statistics” or at the Norwegian Directorate for Education and Training.
Comparability over timeOpen and readClose
Until 2013, the score intervals for each proficiency level were set every year. From 2014 and onwards, the intervals for each level are fixed for the tests in English and mathematics. This means that from 2014 and onwards, it will be possible to compare the results over time. In addition, from 2014, a representative population of six per cent of the pupils will be given so-called anchor items, which will serve to link the tests from year to year, and thus make it possible to compare the results over time. At the present stage, comparison over time will be possible from 2015 in English and mathematics. This will be added to the reading test from 2016, making it possible to compare results in reading over time from 2017 onwards.
The statistics is now published as Marks and national tests, lower secondary school.
