Content
Published:
This is an archived release.
Unchanged picture of the Norwegian economy for 2011 and 2012
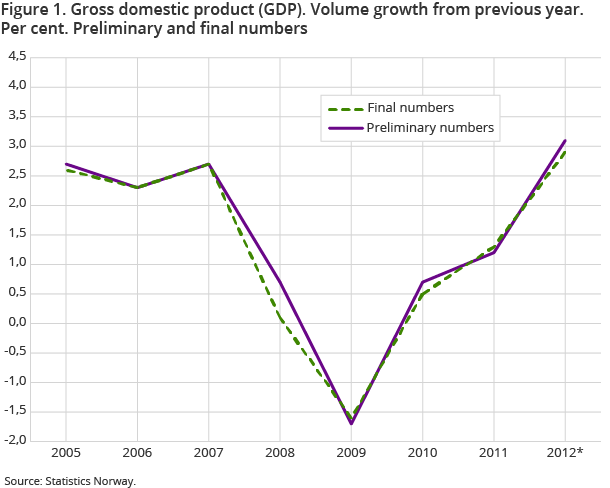
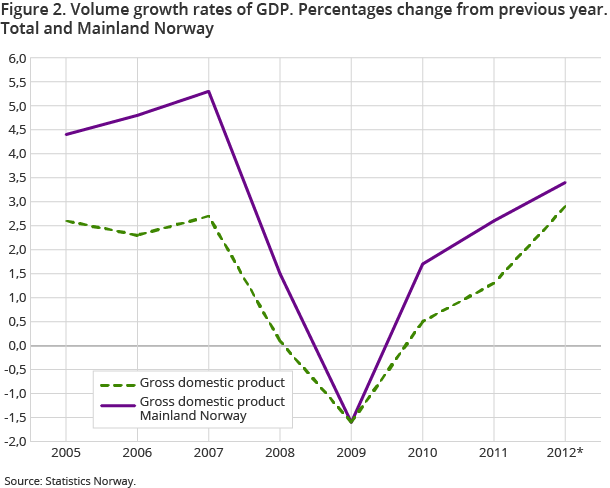
Preliminary figures for 2012 show a GDP growth of 2.9 per cent. This is a downward revision of 0.2 percentage points from previous estimates. The GDP for mainland Norway is unchanged since previously published, and had a growth of 3.4 per cent.
| 2011 | 2012 | |||
|---|---|---|---|---|
| Final figures | Revisjon in per cent point | Revised estimate | Revisjon in per cent point | |
| Growth in gross domestic product (GDP) | 1.3 | 0.1 | 2.9 | -0.2 |
| Gross domestic produkt Mainland Norway | 2.6 | 0.1 | 3.4 | 0.0 |
| Petroleum activities and ocean transport | -3.0 | 0.3 | 1.3 | -0.5 |
| Household final consumption exp | 2.6 | 0.1 | 3.0 | -0.1 |
| Final consumption exp. of general government | 1.1 | -0.7 | 1.8 | 0.0 |
| Gross fixed capital formation. | 7.7 | 0.1 | 8.3 | 0.3 |
| Total exports | -0.7 | 1.1 | 1.1 | -0.7 |
| Total imports | 3.8 | 0.0 | 2.3 | -0.1 |
| Employed persons | 1.6 | 0.3 | 2.2 | 0.0 |
| Houers worked | 1.9 | 0.1 | 2.0 | 0.0 |
| GDP per houers worked | -0.8 | -0.2 | 0.9 | -0.3 |


The downward revision of total GDP by 0.2 percentage points is mainly due to a lower growth rate in ocean transport than previously estimated. Both fishing and aquaculture and production of electricity have had a downward revision, but construction has not been changed since last estimated. This has led to a downward revision of the aggregate production of other goods by 0.9 percentage points. Despite the revision’s lower growth rate for production of other goods, the growth rate was still 8.2 per cent. Manufacturing industries have been adjusted upward by 0.3 percentage points from a growth rate of 2.4 to 2.7 per cent.
Households’ total final consumption had a growth of 3.0 per cent and has been revised down by 0.1 percentage point.
Gross fixed capital formation shows a growth of 8.3 per cent in the new estimated figures, which was close to previous published figures. Export and import also show the same picture as before, although there have been some minor adjustments at the level of goods and services. New implemented data for external trade statistics have led to a downward revision of traditional goods from a growth rate of 2.6 per cent to a growth rate of 1.7 per cent. For 2012, the total export is estimated to grow by 1.1 per cent. Revised figures for import show a growth rate of 2.3 per cent, which is 0.1 percentage point lower than previously published.
Revised final figures for 2011
The growth rate for GDP final annual national account for 2011 has been adjusted upward to 1.3 per cent. This is 0.1 percentage point higher than previously published. GDP Mainland Norway is also adjusted upward by 0.1 percentage point to 2.6 per cent. The reason for the revision of the 2011 final figures is to be found in an increased growth rate for the industries ocean transport, fishing and aquaculture, real estate activities and wholesale and retail trade. In the previously estimated figures, ocean transport had a growth rate of 6.8 per cent, while final figures show a growth rate of 13.2. Manufacturing industries have been revised downward by 0.4 compared to previously published figures. The growth for manufacturing industries for 2011 was 1.6 per cent.
Household consumption had a volume growth of 2.6 per cent in the final figures compared to 2.5 in previous figures. Both households’ consumption of goods and services have been revised upward, but households’ direct purchases abroad have been revised down from 12.0 to 9.4 per cent.
Gross fixed capital formation for both ocean transport and manufacturing and mining shows stronger growth in the final figures than the preliminary figures. Gross fixed capital formation for ocean transport has been upward adjusted by NOK 8 billion, and shows a growth rate of 22.4 per cent in the final figures. The growth rate for gross fixed capital formation for manufacturing and mining was 9.2 per cent. 2011 was the first year since the financial crisis with a positive growth rate.
Concepts and classifications in national accountsOpen and readClose
For more information about definitions of the main concepts, variables and classifications in national accounts, see About the statistics, definitions.
Planned changes in the national accounts statisticsOpen and readClose
New revised figures for national accounts and related statistics will be published in November and December 2014. Statistics Norway complies with international guidelines in its preparation of national accounts and statistics on foreign affairs. New international guidelines have now been issued for these statistics. Statistics Norway is currently in the process of implementing the changes, in addition to new source data for some of the statistics.
The statistics is now published as National accounts.
Additional information
Special tables for experienced users:
Contact
-
Statistics Norway's Information Centre
E-mail: informasjon@ssb.no
tel.: (+47) 21 09 46 42
