Content
Published:
This is an archived release.
Minor changes in mainland Norway’s GDP
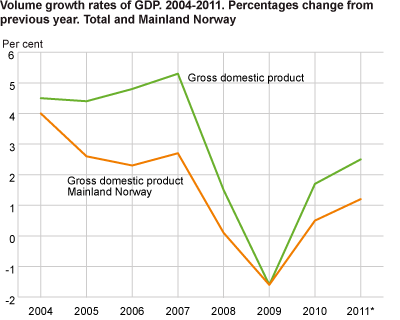
Final figures for 2010 show a GDP growth of 1.7 per cent in mainland Norway; a downward revision of 0.2 per cent from the estimates. Figures for 2011 have also been revised, showing a GDP growth of 2.5 per cent for the mainland economy, which is 0.1 percentage point higher than the previous estimate.
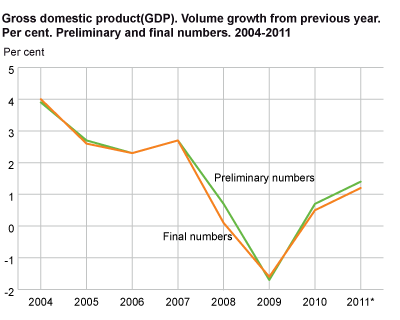
The total GDP has been revised downwards by 0.2 percentage points for both years. The growth in GDP in 2010 and 2011 was 0.5 and 1.2 per cent respectively, according to the revised figures.
Figure 1 shows the preliminary and the final figures for the period 2004-2010. The preliminary figures are the estimates that are published one year before the final accounts. The revision of the preliminary figures for 2011 is also included in graph 1, but in this case the comparison is with the estimate published in May 2012.
2010 - growth in construction lower than initially estimated
The revision of the 2010 figures is mainly due to the downward revision of electricity, gas and water supply and construction business. In particular, for the building and construction industry the preliminary figures showed a decrease in growth of 0.4 per cent, while the final figures show a decrease of 2.8 per cent. On the other hand, according to the final figures, services like telecommunication and information technology had significantly higher growth than previously estimated. Overall, the total volume growth for services excluding general government is 2.2 per cent; an upward revision of 0.6 percentage points. The growth rate for manufacturing and mining remains unchanged from the preliminary figure of 2.4 per cent.
2011 - slightly stronger growth in services
In 2011, the total GDP for mainland Norway passed NOK 2 000 billion, while the total GDP including petroleum and shipping exceeded NOK 2 000 billion in 2006. GDP per capita is around NOK 555 000 according to preliminary figures for 2011. |
The revisions of the 2011 preliminary results compared to the first estimates published in May are minor. There is a small upward revision of some service industries such as professional and scientific services and retail trade, while the preliminary figures for the construction industry have been revised downwards, from a growth of 3.9 to 3.1 per cent.
Preliminary figures for 2011 shows no change of volume in value added for the extraction of crude oil. Services related to petroleum activities have been revised downwards, but the volume growth is still above 18 per cent.
Figure 2 shows volume growth rates of total GDP and GDP for mainland Norway for 2004-2011.
| 2010 | 2011 | ||||||||||||||||||||||||||||||||||||||||||||||||||||||||||||||||||||||||||||||
|---|---|---|---|---|---|---|---|---|---|---|---|---|---|---|---|---|---|---|---|---|---|---|---|---|---|---|---|---|---|---|---|---|---|---|---|---|---|---|---|---|---|---|---|---|---|---|---|---|---|---|---|---|---|---|---|---|---|---|---|---|---|---|---|---|---|---|---|---|---|---|---|---|---|---|---|---|---|---|---|
| Earlier | Revised | Revision in per cent point | Earlier | Revised | Revision in per cent point | ||||||||||||||||||||||||||||||||||||||||||||||||||||||||||||||||||||||||||
| Growth in gross domestic product (GDP) | 0.7 | 0.5 | -0.2 | 1.4 | 1.2 | -0.2 | |||||||||||||||||||||||||||||||||||||||||||||||||||||||||||||||||||||||||
| Gross domestic produkt Mainland Norway | 1.9 | 1.7 | -0.2 | 2.4 | 2.5 | 0.1 | |||||||||||||||||||||||||||||||||||||||||||||||||||||||||||||||||||||||||
| Petroleum activities and ocean transport | -3.9 | -4.0 | -0.1 | -2.6 | -3.3 | -0.7 | |||||||||||||||||||||||||||||||||||||||||||||||||||||||||||||||||||||||||
| Mainland Norway (basic values) | 1.5 | 1.5 | 0.0 | 2.4 | 2.6 | 0.2 | |||||||||||||||||||||||||||||||||||||||||||||||||||||||||||||||||||||||||
| Manufacturing and mining | 2.4 | 2.4 | 0.0 | 2.0 | 2.1 | 0.1 | |||||||||||||||||||||||||||||||||||||||||||||||||||||||||||||||||||||||||
| Production of other goods | 0.6 | -1.4 | -2.0 | 2.6 | 2.2 | -0.4 | |||||||||||||||||||||||||||||||||||||||||||||||||||||||||||||||||||||||||
| Service industries | 1.6 | 2.2 | 0.6 | 2.5 | 2.8 | 0.3 | |||||||||||||||||||||||||||||||||||||||||||||||||||||||||||||||||||||||||
| General government | 1.5 | 1.0 | -0.5 | 2.3 | 2.4 | 0.1 | |||||||||||||||||||||||||||||||||||||||||||||||||||||||||||||||||||||||||
| Final domestic use of goods and services | |||||||||||||||||||||||||||||||||||||||||||||||||||||||||||||||||||||||||||||||
| Household final consumption exp. | 3.8 | 4.0 | 0.2 | 2.5 | 2.5 | 0.0 | |||||||||||||||||||||||||||||||||||||||||||||||||||||||||||||||||||||||||
| Final consumption exp. of general government | 1.7 | 1.3 | -0.4 | 1.5 | 1.8 | 0.3 | |||||||||||||||||||||||||||||||||||||||||||||||||||||||||||||||||||||||||
| Gross fixed capital formation | -5.2 | -8.0 | -2.8 | 6.4 | 7.6 | 1.2 | |||||||||||||||||||||||||||||||||||||||||||||||||||||||||||||||||||||||||
| Mainland Norway | -2.5 | -4.5 | -2.0 | 8.0 | 8.5 | 0.5 | |||||||||||||||||||||||||||||||||||||||||||||||||||||||||||||||||||||||||
| Total exports | 1.8 | 0.4 | -1.4 | -1.4 | -1.8 | -0.4 | |||||||||||||||||||||||||||||||||||||||||||||||||||||||||||||||||||||||||
| Total imports | 9.9 | 9.0 | -0.9 | 3.5 | 3.8 | 0.3 | |||||||||||||||||||||||||||||||||||||||||||||||||||||||||||||||||||||||||
| Growth in employed persons and productivity | |||||||||||||||||||||||||||||||||||||||||||||||||||||||||||||||||||||||||||||||
| Employed persons | -0.1 | -0.5 | -0.4 | 1.4 | 1.3 | -0.1 | |||||||||||||||||||||||||||||||||||||||||||||||||||||||||||||||||||||||||
| Hours worked | 0.8 | 0.1 | -0.7 | 1.6 | 1.8 | 0.2 | |||||||||||||||||||||||||||||||||||||||||||||||||||||||||||||||||||||||||
| Full-time equivalent | 3.7 | 3.7 | 0.0 | 4.2 | 4.2 | 0.0 | |||||||||||||||||||||||||||||||||||||||||||||||||||||||||||||||||||||||||
| GDP per hours worked | -0.5 | 0.1 | 0.6 | -0.3 | -0.6 | -0.3 | |||||||||||||||||||||||||||||||||||||||||||||||||||||||||||||||||||||||||
| Growth in prices | |||||||||||||||||||||||||||||||||||||||||||||||||||||||||||||||||||||||||||||||
| Price deflator for GDP | 6.4 | 6.3 | -0.1 | 6.3 | 6.8 | 0.5 | |||||||||||||||||||||||||||||||||||||||||||||||||||||||||||||||||||||||||
| Price deflator for GDP Mainland Norway | 3.9 | 4.2 | 0.3 | 2.6 | 2.6 | 0.0 | |||||||||||||||||||||||||||||||||||||||||||||||||||||||||||||||||||||||||
| Price deflator for household final consumption exp. | 2.1 | 2.1 | 0.0 | 1.1 | 1.2 | 0.1 | |||||||||||||||||||||||||||||||||||||||||||||||||||||||||||||||||||||||||
For more details see StatBank .
The statistics is now published as National accounts.
Additional information
Special tables for experienced users:
Contact
-
Statistics Norway's Information Centre
E-mail: informasjon@ssb.no
tel.: (+47) 21 09 46 42


