Strong growth in consumption from foreign tourists
Published:
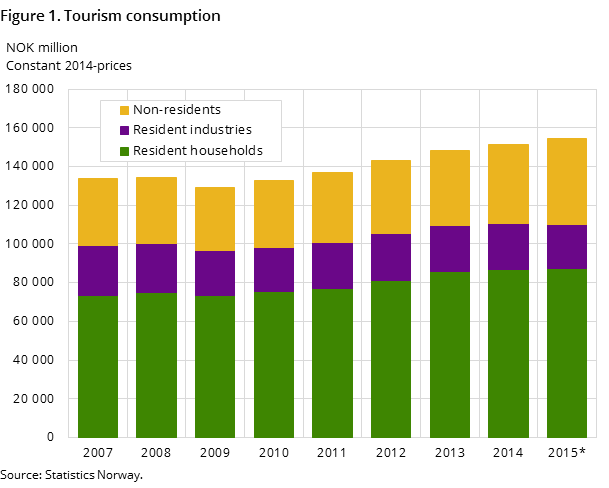
Foreign tourists spent NOK 45 billion in Norway in 2015, according to preliminary results. This group’s tourism consumption in Norway constituted 28.6 per cent of the total tourism consumption. The corresponding figure for 2013 was 26.3 per cent.
- Full set of figures
- Tourism satellite accounts
- Series archive
- Tourism satellite accounts (archive)
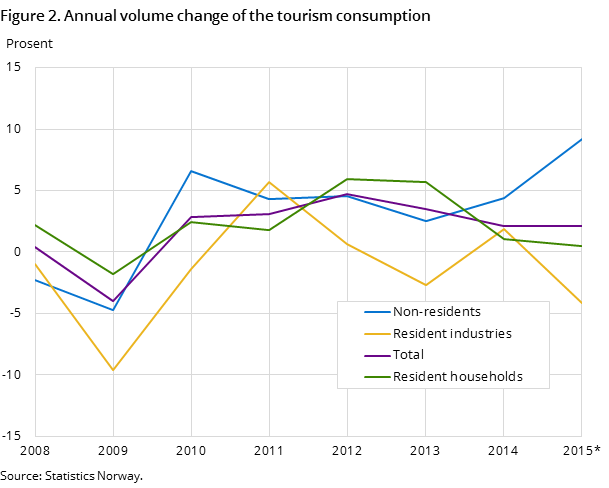
Total tourism consumption is estimated to be almost NOK 160 billion in 2015. This equals an increase in volume of 4.2 per cent from 2013 to 2015. Consumption by foreign tourists increased by 14 per cent measured in volume, in the same period, and the growth was particularly strong from 2014 to 2015. The consumption by Norwegian tourists remained rather stable, however the figures show that there was a decrease in volume for business travellers’ consumption. Norwegian business travellers’ share of the total tourism consumption constituted almost 15 per cent in 2015.
All 2015 results are preliminary.
Foreign guest nights increased by more than 1 million in 2014 and 2015 in total. The number of guest nights increased more for Norwegians than for foreign guests, but in relative terms the growth in guest nights was significantly higher for the latter. More and more tourists are coming from countries that are small markets for Norwegian tourism, and foreign tourists had to travel further to get here than those in earlier years. More of the new foreign tourists stayed in hotels and other commercial accommodation establishments than previously, and spent more on tourism services such as transport to Norway and adventure activities in Norway. This is evident from the results of the satellite accounts, where it is estimated that foreigners used about 15 per cent more on accommodation and restaurant services in 2015 than in 2013, measured in volume.
The relations between the various tourist types and their development from 2007 to 2015 are illustrated in figures 1 and 2.
Good growth in output in the tourism industries
When assessing the significance of tourism, it is useful to analyse the industries producing tourism products, and to compare these with the overall economy.
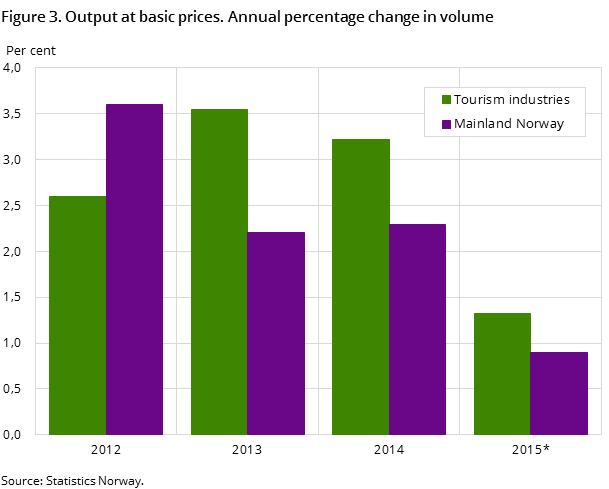
The output in the tourism industries is preliminarily estimated at NOK 270 billion in 2015, which equals a 4.5 per cent growth in volume from 2013. This was a higher growth rate than for Mainland Norway, which was 3.2 per cent for the same period. See figure 3. The tourism industries’ share of the total output in Mainland Norway was 5.9 per cent in 2015, which was rather similar to previous years.
Despite good output growth, the costs measured in constant prices increased more than the output, and the value added in volume remained unchanged from 2013 to 2015. The low result was due to a particularly large increase in costs for air and sea transport in 2014. At the same time, the remaining tourism industries experienced a total volume growth in value added of more than 5 per cent. The value added in the tourism industries is preliminarily estimated at NOK 111 billion in 2015.
A total of 158 000 FTEs (employment measured in full-time equivalents) were performed in the tourism industries in 2015. This constituted 6.7 per cent of all FTEs worked in Mainland Norway. The share remained constant throughout the years 2013-2015.
Highest value added per employed person in Oslo
As part of the tourism satellite accounts, output, value added and employees in the tourism industries have been computed for each county. The calculations are made for the reference year 2014, as this is the most recent year available for the regional accounts that form the basis for these calculations.
In 2014 in Oslo, the value added per employed person was 20 per cent higher than the country average. Akershus and Vestfold were 16 and 12 per cent above the average respectively. These are the same top three counties as in 2013. Otherwise, the distribution and number of counties whose value added per employed person was above the national average has changed. In 2013, Rogaland was the only other county to pull up the average, while in 2014 it pulled up the average slightly but was surpassed by Svalbard, Møre og Romsdal and Vest-Agder.
In comparison, the value added per employed person in Finnmark and Sogn og Fjordane was more than 30 per cent below the country average. It is important to note here that we are talking about the number of employed people and not the number of FTEs performed. The tourism industries have a large share of seasonal and part-time workers. In 2015, there were almost 20 per cent more employed people in the tourism industries than FTEs performed. In total in Mainland Norway, the ratio was a good 15 per cent. In counties where a large part of the activity is seasonal, the value added per employed person will be lower than for counties with business all year round.
The results for 2014 are illustrated in figure 4.
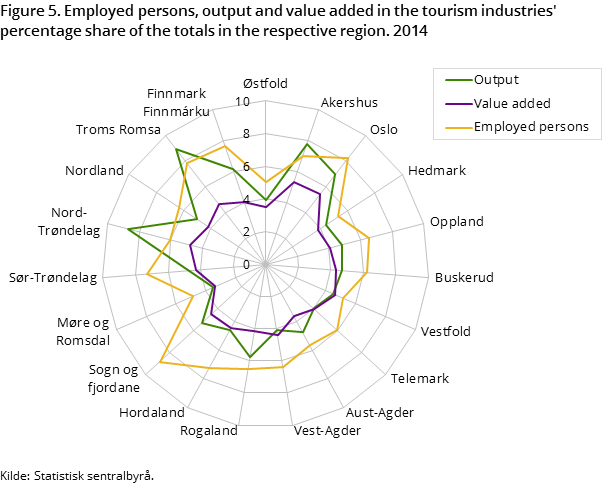
Measured in the number of employed people, Sogn og Fjordane, Oslo and Troms had the most people employed in the tourism industries compared with the total employed in the respective county. This was the same as in 2013. In all three counties, around 8 per cent of all people employed worked in the tourism industries.
The shares are illustrated in figure 5.
Oslo, Akershus, Hordaland and Rogaland were the counties experiencing the highest activity level in the tourism industries. A quarter of the output and value added in the tourism industries was from Oslo, while the other three accounted for almost 35 per cent.
Contact
-
Anne Mari Auno
-
Statistics Norway's Information Centre


