Content
Published:
This is an archived release.
Large decrease in newspaper reading and TV watching
Fewer people read printed newspapers and online versions of newspapers on an average day in 2015 than the year before. The number of persons watching TV has declined. We spend more time on the Internet, and use of social media is still increasing.
| 1991 | 2000 | 2014 | 2015 | |
|---|---|---|---|---|
| Newspapers | 84 | 77 | 49 | 42 |
| Television | 81 | 82 | 74 | 67 |
| Radio | 71 | 57 | 64 | 59 |
| Audio media | 43 | 50 | 39 | 38 |
| Weeklies | 21 | 17 | 8 | 7 |
| Books | 24 | 20 | 25 | 23 |
| Magazines | 18 | 14 | 9 | 8 |
| Cartoons | 11 | 9 | 4 | 3 |
| PC | .. | 25 | 75 | 0 |
| Video media | 10 | 10 | 22 | 21 |
| Internet | .. | 27 | 88 | 87 |


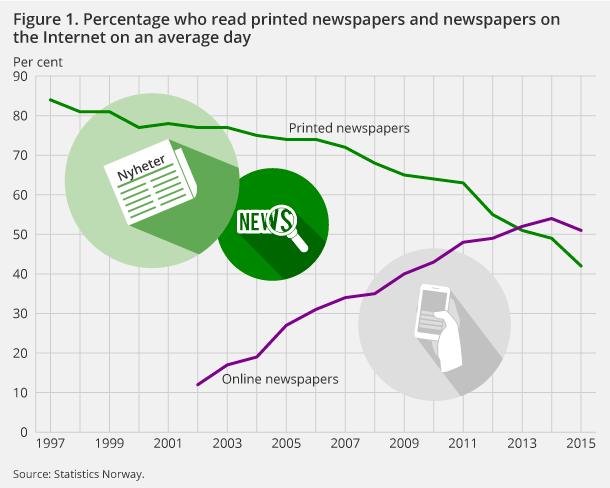
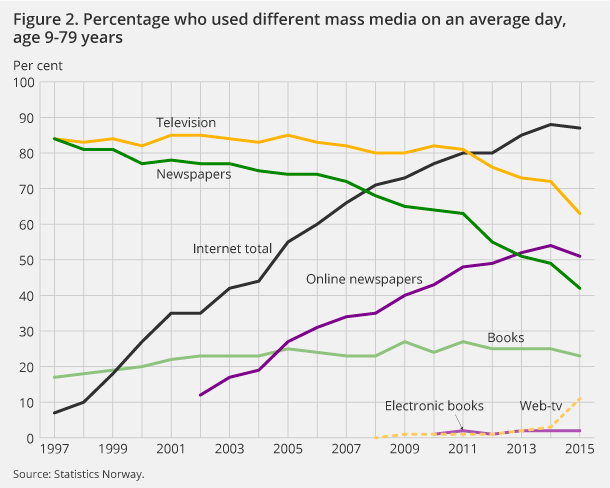
There has been a decrease in reading printed newspapers on an average day among persons aged 9-79 from 2014 to 2015. In 2015, 42 per cent of the population read one or more printed newspapers on an average day, compared to 49 per cent one year before. This trend has been ongoing for a long time. In 1997, the percentage was 84. Reading online versions of newspapers has also declined somewhat (see figure 1). The number of readers was 51 per cent on an average day in 2015, compared to 54 per cent in 2014. This means that the overall number of newspaper readers has decreased from 75 per cent in 2014 to 72 per cent in 2015.
Decline in TV watching
The portion watching TV on an average day, i.e. transmissions on the different channels, has been fairly stable for many years, at more than 80 per cent. In recent years, however, there has been a decline. This also applies for the last year. Seventy-four per cent watched TV per day in 2014, compared to 67 per cent in 2015. The decline applies to both men and women and to all age groups. Watching TV via the Internet, i.e. watching TV programmes that are broadcast via the Internet at the same time as the ordinary TV transmission, is not yet a rival to traditional TV watching. While 63 per cent watched TV programmes on ordinary TV, 11 per cent watched the programmes via the Internet. The time we spend watching TV saw a considerable decline last year. While average TV watching per day was 132 minutes in 2014, the corresponding figure for 2015 was 107 minutes.
More people spend time on the Internet and social media
The proportion spending time on the Internet during a typical day has increased considerably in recent years, but there has been no increase in the last year, with 88 per cent in 2014 and 87 per cent in 2015. The time we spend on the Internet per day has grown somewhat, from 120 minutes in 2014 to 127 minutes in 2015. Never before has the population spent so much time on the Internet on an average day. The increase applies to both men and women, and for everyone between the age of 9 and 44. The 16-24-year-olds are the most eager users, with 3 hours and 33 minutes per day.
Among those who are on the Internet during a typical day, 70 per cent had spent time on Facebook and 44 per cent had spent time on other social media in 2015. The use of social media has increased considerably in the last year. Forty-four per cent of Internet users had spent time on bank services during a day and 73 per cent had read news.
Use of streamed audio files and video media is increasing
Sixty-eight per cent of those who had listened to audio media (excluding radio) on an average day in 2015 listened to streamed files from the Internet. One year earlier the figure was 60 per cent. The proportion that uses CD players, on the other hand, is in decline. The proportion listening to audio media in total has remained at the same level as the year before, and was 38 per cent in 2015.
The proportion spending time on video media on a typical day had previously seen little change. Since 2012, when paid streaming services via the Internet, such as Netflix, were included in the survey, the number of persons watching video media has grown. In 2014, the proportion was 22 per cent, and in 2015 it was 21 per cent. As many as 65 per cent of these users were streaming paid video files. DVD/Blu-ray was used by16 per cent and hard disc players were used by19 per cent.
59 per cent listen to radio
The number of radio listeners during a typical day has declined somewhat in the last year, with 64 per cent in 2014 and 59 per cent in 2015. While 55 per cent listened to ordinary radio, 4 per cent listened to programmes online that were broadcast simultaneously. Twenty-four per cent of the population listened to a DAB radio during the day in 2015, compared to19 per cent the year before.
53 per cent have a DAB radio
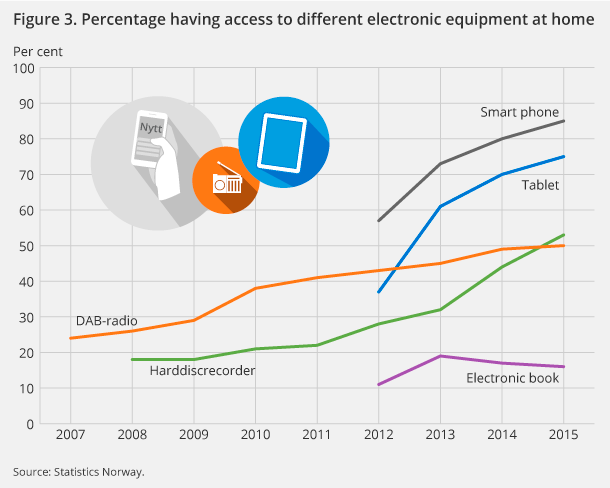
Fifty per cent had access to a hard disc recorder at home in 2015, compared to 49 per cent the year before (see table 1). Fifty-three per cent had a DAB radio in 2015, an increase from 44 per cent in 2014. Fifty per cent had one or more newspaper subscriptions in the household in 2015, compared to 54 per cent in 2014. Twelve per cent had a paid subscription for an online newspaper in 2015, compared to 9 per cent the year before.
Few read e-books
The percentage that read printed books on an average day was 23; somewhat less than the two earlier years. Only 2 per cent read electronic books during a typical day. The percentage reading magazines and comic books on an average day has changed little from 2014 to 2015. This also applies to scientific/trade journals. The percentage using these media has declined gradually in recent years. Reading of magazines and comic books is less prevalent than for scientific/trade journals, but the percentage of magazine readers is doubled when we include online reading of such media.
Contact
-
Emma Schiro
E-mail: emma.schiro@ssb.no
tel.: (+47) 91 39 78 91
-
Emmie Stolpe Foss
E-mail: emmie.foss@ssb.no
tel.: (+47) 40 81 14 30
-
Elisabeth Haraldsrud
E-mail: elisabeth.haraldsrud@ssb.no
tel.: (+47) 40 81 15 00
