Content
Published:
This is an archived release.
More time spent on Internet
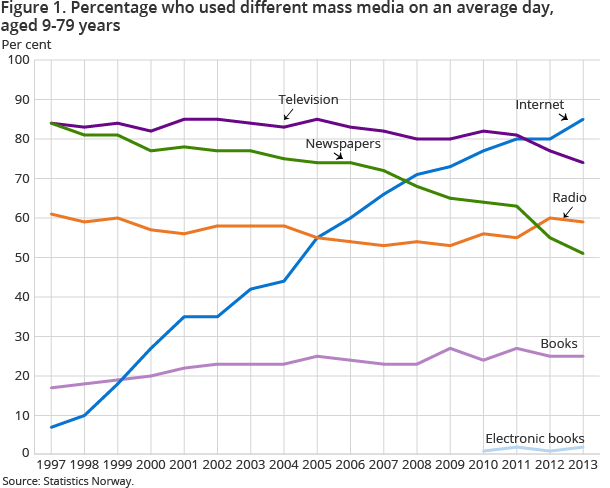
A larger portion of the population spent time on the Internet in 2013 compared to 2012. The percentage reading printed papers and spending time watching TV per day is declining. There is a stable percentage listening to the radio. The time we spend on the Internet is growing considerably. While 25 per cent read printed books daily, only two per cent read electronic books.
| 1991 | 2000 | 2012 | 2013 | |
|---|---|---|---|---|
| Newspapers | 84 | 77 | 55 | 51 |
| Television | 81 | 82 | 77 | 74 |
| Radio | 71 | 57 | 60 | 59 |
| Records/Cassettes/CD/MP3 | 43 | 50 | 40 | 41 |
| Weeklies | 21 | 17 | 10 | 8 |
| Books | 24 | 20 | 25 | 25 |
| Magazines | 18 | 14 | 9 | 9 |
| Cartoons | 11 | 9 | 4 | 4 |
| PC | .. | 25 | 70 | 75 |
| Video | 10 | 10 | 11 | 10 |
| Internet | .. | 27 | 80 | 85 |

The proportion of people spending time on the Internet per day has grown considerably in recent years. In 2012, the percentage was 80. In 2013, it increased to 85 per cent. The actual time spent on the Internet has also increased; from 95 minutes in 2012 to 112 minutes in 2013. The increase applies to both genders and all age groups, except the most elderly.
There has been a decline in reading printed newspapers on an average day among persons aged 9-79 years in the last year. In 2013, 51 per cent of the population read one or more printed newspapers on an average day, compared to 55 per cent in 2012. In 1997, the percentage was 84.
Less persons watching TV
The proportion watching TV on an average day, i.e. watching transmissions from different channels, has remained fairly stable in recent years, at slightly more than 80 per cent. In the last two years there has been a decline. From 2012 to 2013, the percentage declined from 77 per cent to 74 per cent. The decline primarily applies to persons in the age group 16-24 years. Time spent watching TV has also declined considerably, from 157 minutes in 2011 to 132 minutes in 2013.
The percentage listening to the radio on an average day has increased during the last two years; with 55 per cent in 2011 and 59 per cent in 2013, which was about the same as 2012. Thirteen per cent listened to a DAB radio during the day in 2013, the same as in 2012.
Fall in the use of CDs
Seventy per cent of those who used sound systems on an average day in 2013 listened to audio files from the Internet. In 2012, the percentage was 67. The proportion using CD players is declining. It was 93 per cent in 2003 and was down to 34 per cent in 2013. The percentage listening to sound players on an average day in total was 41 in 2013, approximately the same as the year before.
The percentage of book readers on an average day was 17 in 1997. This has subsequently increased. In 2013 it was 25 per cent, the same as in 2012. The share of persons who read weekly publications and cartoon publications on an average day has changed little from 2012 to 2013.
Two per cent read electronic books
Twenty-one per cent of the population played TV games or computer games during an average day in 2013. In addition, 1 per cent used palmtop games consoles. Eighty-two per cent had a private mobile phone conversation and 54 per cent used the Internet via a mobile phone. Two per cent read electronic books during the day.
32 per cent have a DAB radio
Forty-five per cent had access to a hard disc recorder in their household in 2013, compared to 43 per cent in 2012. Ninety-six per cent had access to the Internet in the household, compared to 95 per cent in 2012. Thirty-two per cent had a DAB radio in 2013, compared to 28 per cent in 2012. Fifty-eight per cent of the population had one or more newspaper subscriptions in their household in 2013. In 2012, the percentage was 62.
For further reading, refer to the Norwegian media barometer for 2013.
Contact
-
Emma Schiro
E-mail: emma.schiro@ssb.no
tel.: (+47) 91 39 78 91
-
Emmie Stolpe Foss
E-mail: emmie.foss@ssb.no
tel.: (+47) 40 81 14 30
-
Elisabeth Haraldsrud
E-mail: elisabeth.haraldsrud@ssb.no
tel.: (+47) 40 81 15 00
